Following futures positions of non-commercials are as of April 30, 2024.10-year note: Currently net short 433k, up 79k.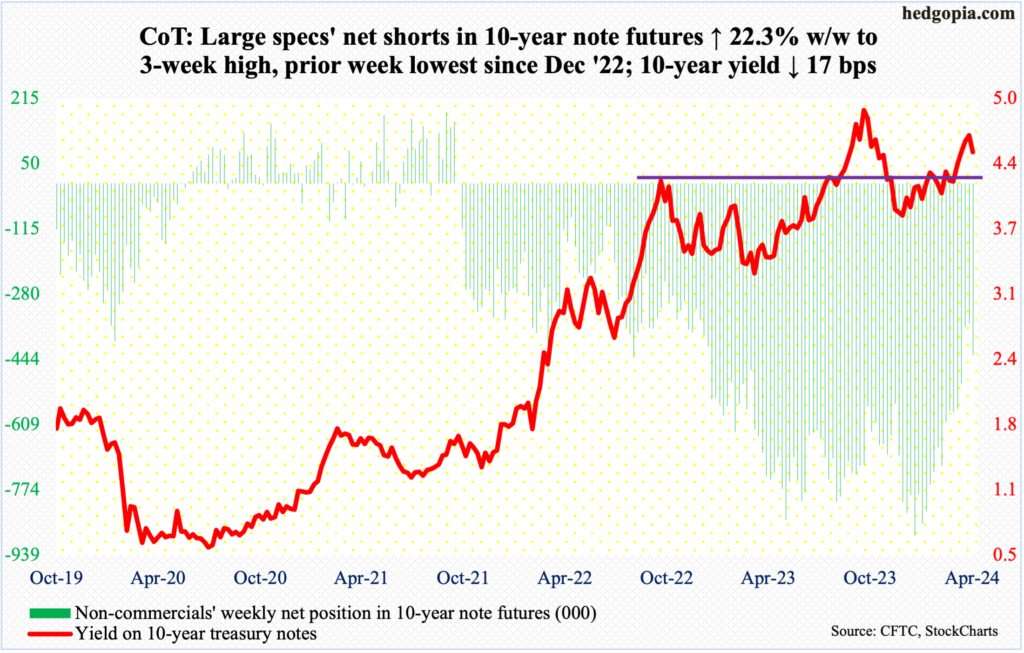 In an FOMC week in which Chair Jerome Powell was anything but a hawk, aided by weaker-than-expected economic data including April’s payrolls, the 10-year treasury yield gave back 17 basis points to 4.5 percent. This was preceded by four up weeks in a row, with the last three forming a weekly spinning top, a shooting star and a spinning top.Rates touched five percent last October before dropping to 3.79 percent in December. In the subsequent rally, the 10-year ticked 4.74 percent on April 24th and headed south.The path of least resistance is down. There is horizontal support at 4.35s. The 50- and 200-day moving averages lie around there – 4.38 percent and 4.31 percent, in that order. In the event of a rally, there is resistance at 4.57 percent.Non-commercials, in the meantime, added this week to their net shorts in 10-year note futures, but at the same time their holdings have been more than cut in half since setting a record as of January 16th this year. If the 10-year yield rallies in the near term, these traders will likely use this as an opportunity to continue to cover.30-year bond: Currently net short 23.1k, up 1.9k.
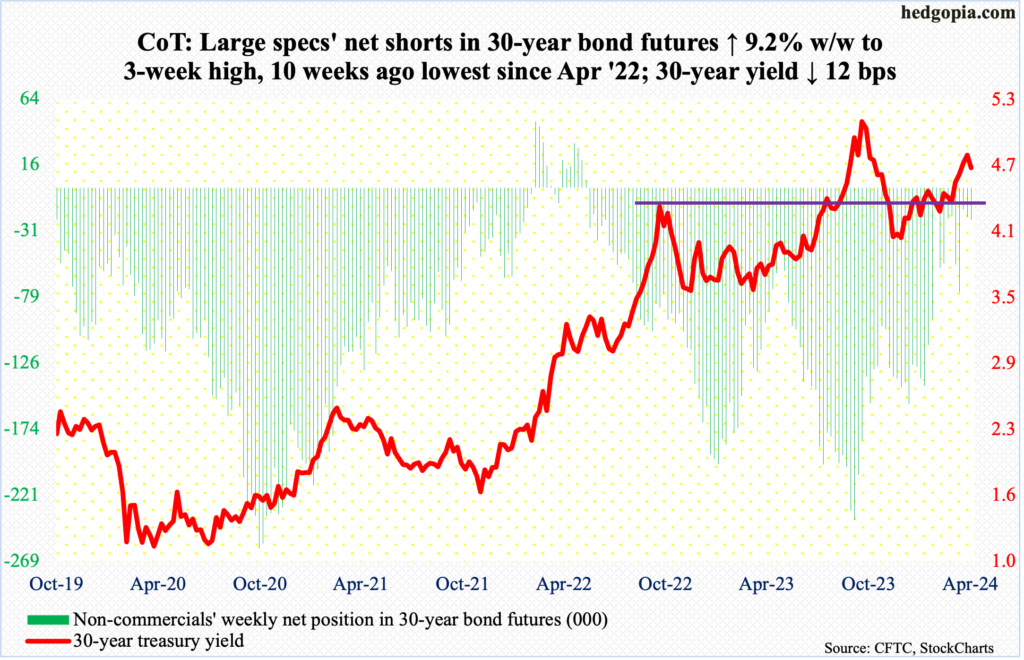 Major US economic releases for next week are as follows.Consumer credit (March) is due out Tuesday. Total consumer credit in February was up 2.5 percent year-over-year to $5.05 trillion – a new record. This is comprised of $1.34 trillion in revolving and $3.71 trillion in non-revolving, which respectively increased nine percent and 0.4 percent from a year ago.Friday brings the University of Michigan’s consumer sentiment index (May, preliminary). In April, sentiment slid 2.2 points from March’s 79.4, which was the highest since July 2021.WTI crude oil: Currently net long 259.7k, down 18.8k.
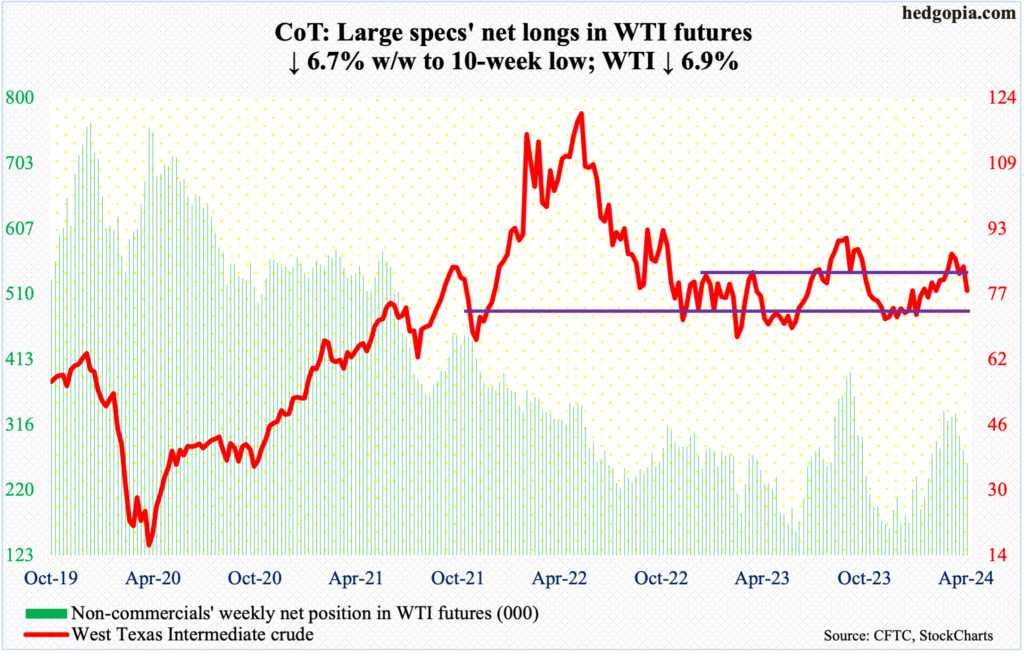 West Texas Intermediate crude dropped in all sessions this week, down 6.9 percent for the week to $78.11/barrel. This was the third down week in four. The crude rallied from $67.71 last December to $87.67 on April 12th before coming under pressure.This week, both the 50- and 200-day were breached. WTI concurrently fell back into a well-established range between $71-$72 and $81-$82 that persisted for 19 months before the upper end gave way five weeks ago. Even more important, it ended the week right on a rising trendline from last December’s low. A likely breach can eventually open the door toward the lower end of the range in question.In the meantime, US crude production in the week to April 26th was unchanged for eight consecutive weeks at 13.1 million barrels per day; 10 weeks ago, output was at a record 13.3 mb/d. Crude imports increased 275,000 b/d to 6.8 mb/d. As did crude and gasoline inventory, which respectively rose 7.3 million barrels and 344,000 barrels to 460.9 million barrels and 227.1 million barrels. Distillate stocks, however, dropped 732,000 barrels to 115.9 million barrels. Refinery utilization declined one percentage point to 87.5 percent.E-mini S&P 500: Currently net long 43.1k, down 24.5k.
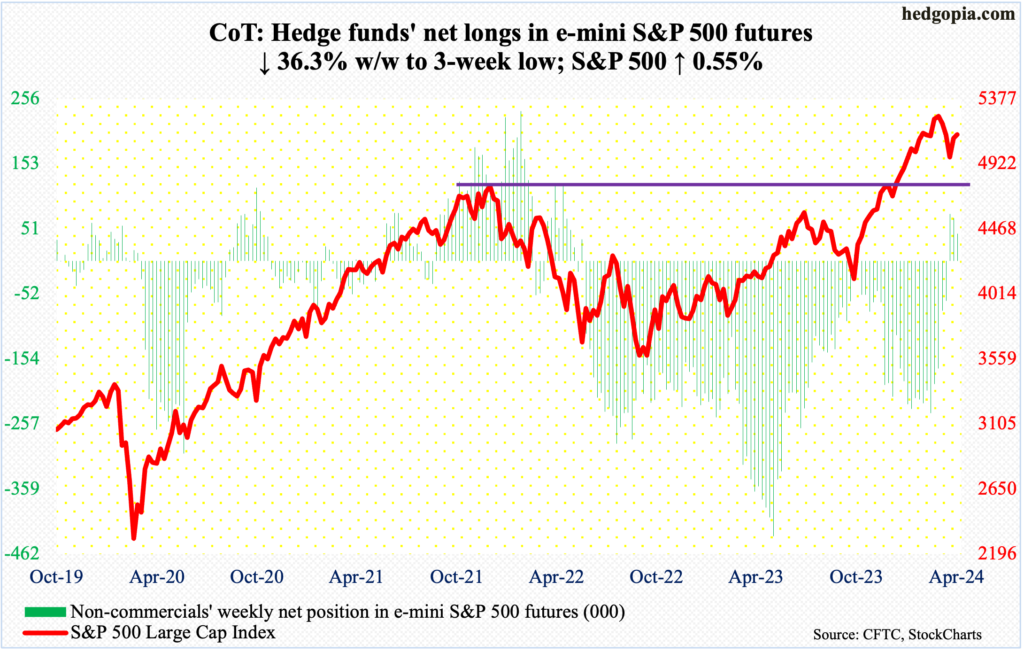 Equity bulls should be very happy with how things turned out this week. The S&P 500 rallied 0.6 percent but at Thursday’s low of 5011 was down 1.7 percent for the week. That low was bought, with the bulls gapping up the index (5128) on Friday to close out the week at the 50-day (5130). Earlier on Monday, their advance was stopped at that average. In the likely event the average gets taken out next week, the next layer of resistance lies at 5170s.The large cap index peaked at 5265 on March 28th and the subsequent selling stopped at 4954 on April 19th.Euro: Currently net short 6.8k, down 3.2k.
 The euro, up 0.6 percent this week, rallied for the third consecutive week in a row. It has rallied since bottoming at $1.0601 on April 16th. Earlier, it came under pressure after ticking $1.0981 on March 8th. Even before that on December 27th, it retreated after tagging $1.1125 and $1.1270 on July 18th. Trendline resistance from these highs lies at $1.09. Euro bulls could very well be eyeing this.On the weekly, there is room for the currency to move higher. The daily, however, is beginning to get overbought. On Friday, it rallied as high as $1.0813 but reversed hard to end the session/week at $1.0761 – below both the 50- and 200-day (at $1.0793 and $1.0803 respectively) – forming a daily shooting star. It is hard to imagine these averages giving way right away.Gold: Currently net long 204.2k, up 1.3k.
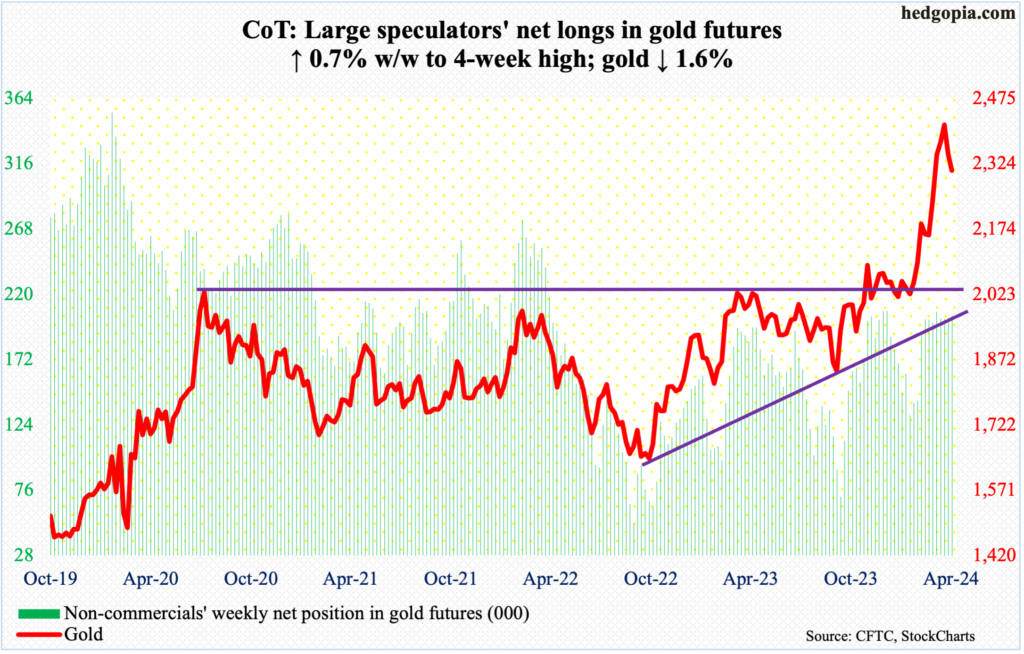 Bids showed up this week well before testing horizontal support at $2,240s, which is where the 50-day now lies. Gold dropped 1.6 percent this week to $2,309/ounce, with Friday’s low tagging $2,285. This was the second weekly decline in a row.The metal has been unwinding the overbought condition it is in since bottoming at $1,824 last October and at $1,996 as recently as February 14th. On April 12th, the metal printed a new intraday high of $2,449 but only to then reverse hard to close the session at $2,361.The weekly remains overbought. At some point, gold bugs will be forced to defend breakout retest at $2,080s, which the yellow metal broke out of in early March. Right here and now, they have an opportunity to put their foot down. Nearest resistance lies at $2,350s.Nasdaq (mini): Currently net long 2.8k, down 3.4k.
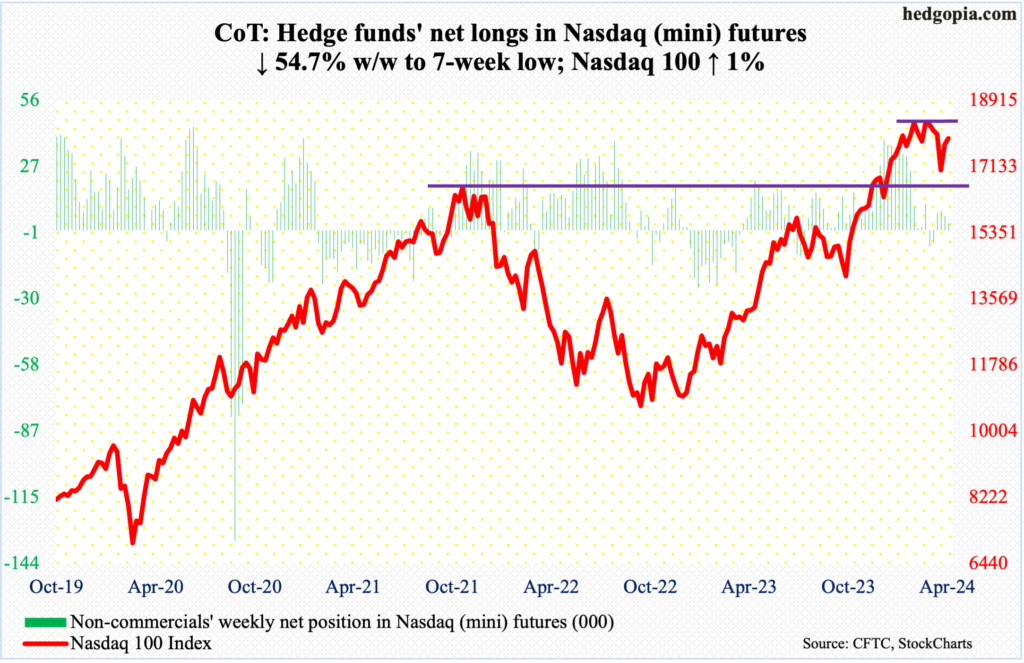 Tech bulls got help from both the FOMC and earnings this week (). On Wednesday, Chair Jerome Powell shot down the idea of the possibility of a rate hike (). Then, March-quarter results from both Amazon () and Apple () pleased investors. The rally in the last two sessions culminated in a one-percent gain for the week, which at one point was down 2.4 percent.When it was all said and done, the Nasdaq 100 (17891) finished just under the 50-day (17927). The tech-heavy index peaked at 18465 on March 21st, failing to sustainably break out of 18300s for seven weeks before rolling over. Before this resistance gets tested, tech bulls will first have to clear 18100, which represents trendline resistance from that high.Russell 2000 mini-index: Currently net short 40.3k, up 4.2k.
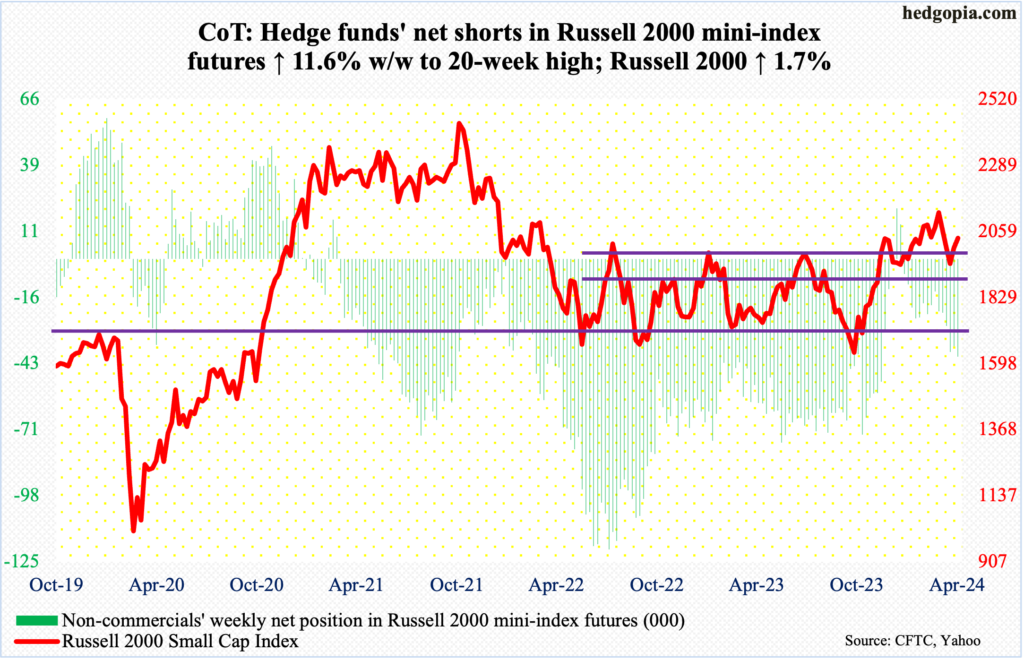 The Russell 2000 rallied 1.7 percent for the week, but small-cap bulls are probably not happy with how Friday fared; the session gapped up to add 1.9 percent intraday but only to reverse to end up one percent to 2036 – just under the 50-day at 2039.On a closing basis, support at 2000 was breached both Tuesday and Wednesday, touching 1968 intraday Wednesday. At the same time, the small cap index retreated well before reaching 2100 resistance, ticking 2055 on Friday.The index remains rangebound.US Dollar Index: Currently net short 35, down 178.
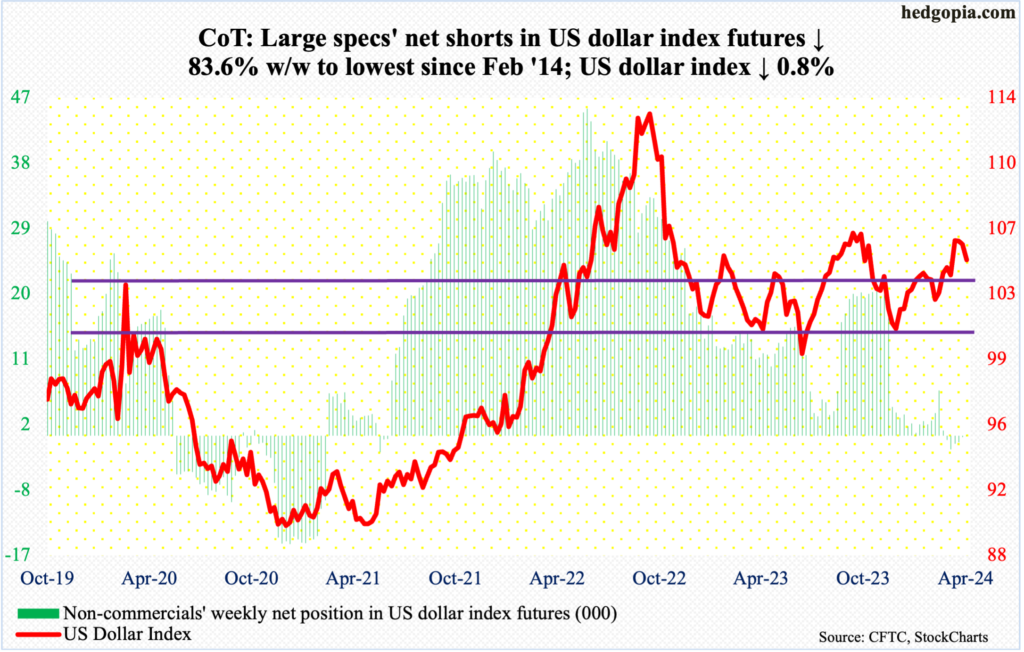 On Wednesday, the US dollar index rallied as high as 106.38 but only to retreat. By Friday, it was down 0.8 percent for the week to 104.92. This was the fourth week in a row the index stalled just north of 106.Earlier, the index bottomed at 100.32 last December, followed by a takeout three weeks ago of 103-104, which goes back to December 2016.A crucial test lies ahead. A rising trendline from the December low draws to 104. It is unlikely this support is lost right away. Even on Friday, the intraday low of 104.41 – barely above the 50-day at 104.39 – was bought. That said, the weekly remains way overbought and it is just a matter of time before this trendline is compromised.VIX: Currently net short 22.4k, up 4.4k.
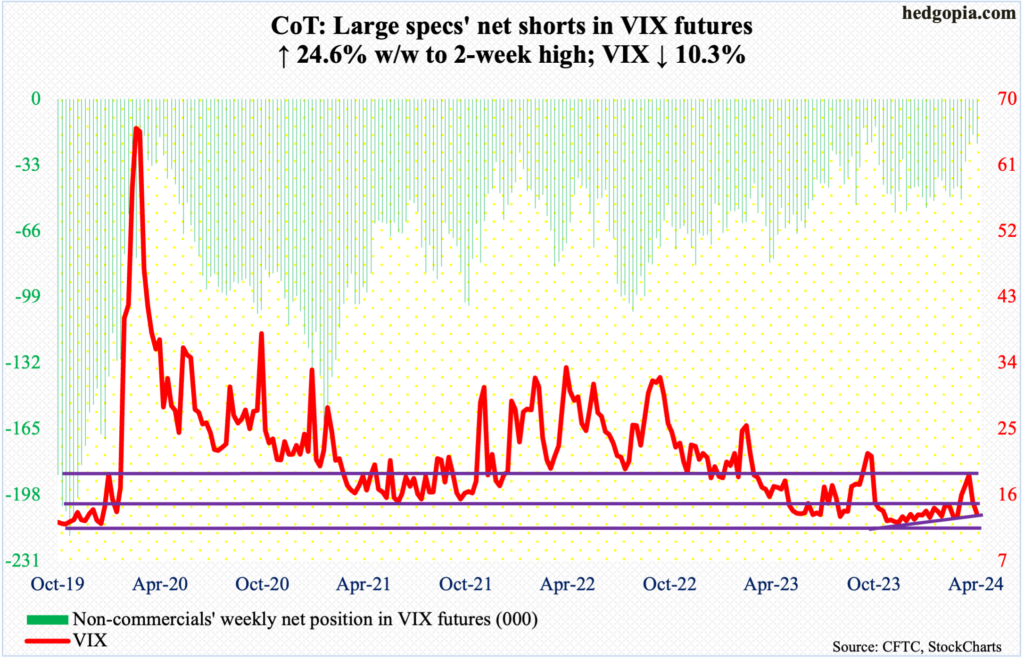 The last time VIX’s weekly RSI rallied above 70 was March 2020; since then, the momentum metric has struggled to rally above 63. This was also true this time, when it turned back down three weeks ago; this was when the volatility index tagged 21.36 and retreated. VIX fell in the subsequent two weeks, with this week’s close of 13.49 comfortably breaching the 50- and 200-day.VIX is oversold on the daily, and this could very well be a make-or-break moment for volatility bulls. The index closed the week right on a rising trendline from last December when it ticked 11.81 and rallied. This is a must-save.Thanks for reading!


