Selling A New Put On Cummins
By Paul Price of Market Shadows We closed-out our Cummins (CMI) January 2014 $110 put for $1.40 per share on September 19 when the shares were riding high. We booked a $960 gain in just over seven months. The details of that Sold to Open/Bought to Close (STO/BTC) transaction are shown below. This morning CMI shares are down more than 8% after a badly received quarterly report. We still like the stock. Accordingly we sold a new CMI January 2015, $110 strike price put contract for $1040.00 ($10.40 per share). As long as we are short the put, we are committed to buy 100 CMI shares at a net cost of $110 (the strike price) minus $10.40 (the put premium) = $99.60 per share. Thus $99.60 is our break-even price. Cummins has not spent one day in 2013 below our break-even price on this trade. Cummins traded as high as $139.17 just days ago. The great put price comes from the combination of today’s big drop and the increased implied volatility–factors which contribute to great timing for put sales. The new trade will be recorded in our Virtual Put Writing Portfolio. Maximum profit would be keeping the $1,040 we received upon sale of the put without ever having to buy the stock. We’ll achieve that result if CMI remains above $110 on the Jan. 17, 2015 expiration date. Our maximum risk is to be forced to buy 100 shares of CMI at less than $100 […]
EC Quantitative Easing: Does Money Grow On Trees?
Lee Adler speaks with CNBC’s Lindsay Williams about Quantitative Easing.
EC Housing Indicator Review – Pending Home Sales- No Hype, Just The Facts
Courtesy of Lee Adler of the Wall Street Examiner Is the latest episode of the long running US housing bubble saga actually coming to an end? From the way the NAR reported that pending home sales had a year to year decline you would think so. Only that was not true. Their actual PHI index was 91.4 in September. That compares with 90.4 in September 2012. As far as I can tell that’s a 1.1% increase, which isn’t good, but it’s not a decline. The NAR compared two fictional seasonally adjusted numbers, both from the exact same time each year, making a seasonally adjusted comparison inappropriate. They managed to finagle that into a year to year decline. Dow Jones Marketwatch reported a year to year decline without further comment in an example of how financial “journalism” simply regurgitates industry PR without further comment or qualification. Where is the interest in the facts? Bloomberg, to its credit, reported the facts accurately in this case. “The Realtors’ report showed purchases rose 1.1 percent from September 2012.” However, even though they got this one right, they are just guilty of misrepresentation at times. The NAR reported a seasonally adjusted headline decline of 5.6% month to month in September. That was a lot worse than economists’ consensus expectations of -1.3%. Economists fooled again! Who’d a thunk? The seasonally adjusted headline number may or may not represent reality. It isn’t the actual number. It’s essentially an idealization based on a few years of past performance for […]
Million Dollar Vote Of Confidence On Coach
Million Dollar Vote of Confidence on Coach By Paul Price of Market Shadows On Oct. 24, Coach’s (COH) outgoing CEO and Chairman Lew Frankfort bought 21,000 shares of Coach for $1,015,980, an average cost of $48.38. He now directly holds 2,053,141 shares. (See SEC filing.) Frankfort’s most recent previous transaction was a sale on March 31, 2012. He sold 100,000 shares for $7.7 million, an average of $77.40 per share. Maybe Mr. Frankfort is a smart of his company’s equities. Coach is a holding in our Virtual Value Portfolio. We also sold a put on COH last week in our Virtual Options Selling Portfolio.
Stock Market Trend – Eye Opening Information
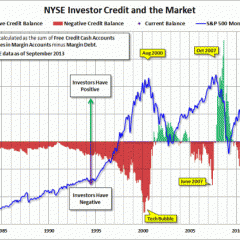
My stock market trend analysis is often different from others because I look at both sides from a technical standpoint. Since the stock market bottom in 2009, equities have been rising, but this train could be setting up to do the unthinkable. Let’s take a look at two possible outcomes. The Bear Market Trend & Investor Negative Credit The S&P500 has been forming a large broadening formation over the last 13 years. The recent run to new highs and record amounts of money being borrowed to buy stocks on margin has me skeptical about prices continuing higher. Take a look at the chart below by Doug Short. This chart shows the SP500 index relative to positive and negative investor credit balances. We are starting to reach extreme leverage again on the stock market. We may be close to a strong correction or possible bear market, but a correction may be all we get. A simple 2-6 week correction may free stocks up to continue higher. Monthly Bearish Trend Outlook The average bull market lasts four years (it has been four years). Poor earnings continue to be released for many individual names across all sectors of the market. While corporate profits may be growing in some of the bigger companies, revenues are not. This suggests that workers are being laid off and companies are cutting costs. Overall the stock market is entering its strongest period of the year and I do not expect it to turn down all at once. Major market tops are a […]


