by John Mauldin, Thoughts from the Frontline
“Inflation is as violent as a mugger, as frightening as an armed robber, and as deadly as a hit man.” – Ronald Reagan
“To me, a wise and humane policy is occasionally to let inflation rise even when inflation is running above target.”– Janet Yellen

The US economy grew at a 1.5% inflation-adjusted rate in the third quarter, or so said the Bureau of Economic Analysis in its first GDP estimate last week. The number is subject to revision and will probably change. Based on recent experience, revisions could easily push it below 1% or above 2%. Since this is “real” GDP, it also depends on inflation numbers. BEA doesn’t use the familiar Consumer Price Index for this purpose – CPI comes from an entirely different agency, the Bureau of Labor Statistics.
You can get quite different real GDP growth numbers if you use the inflation figures calculated by the Dallas Federal Reserve Bank. The Dallas Fed developed something called trimmed PCE, the use of which would make real 3Q GDP growth 1.1%. Or, if we all decided that the calculation of “median CPI” performed by the Cleveland Fed was what we should use, then GDP growth was about 0.3%. (Which is of course why we don’t use it!)
And gods forbid we use the method employed in Europe for calculating inflation. Evidently, housing is not a very big deal in Europe, so it is a much smaller component of the inflation calculation; and if you can believe it, the Europeans actually use an archaic methodology for calculating housing inflation that involves the real prices of home sales, as opposed to a totally artificial guesstimate called Owner’s Equivalent Rent, used by more sophisticated countries like the United States. If we had done things the European way, inflation would have been sky-high during the last decade, and the Federal Reserve would have been forced to raise rates rather than holding them under 1% for far too long. And who knows where the inflation rate would have gone if we hadn’t pricked our little housing bubble.
This week’s letter is all about how we create the sausage that is called inflation. The Fed has a target of 2% inflation. Aren’t we almost there at +1.9% CPI? Not really, as the Fed uses something called the PCE, and it is barely at +1.3%. Which is different again from other measures of inflation. Confused? Hopefully, we can make sense of inflation today and have some fun along the way with crazy government statistics.

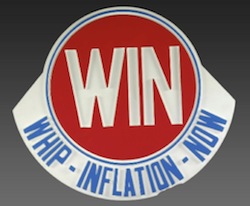
If, like me, you are ancient enough to remember the 1970s, you will recall that inflation was Economic Enemy #1. Presidents Gerald Ford and Jimmy Carter spent most of their terms trying to
Whip InflationNow. Their inability to tame it is one reason neither had a second term.
Fast-forward to the twenty-teens. Inflation is still top of mind, but this time it’s because we don’t have enough of it. The Federal Reserve and every other central bank on the planet now wants to enlist inflation in the fight against the present foe, deflation. I guess that instead of the buttons that Gerald Ford passed out, which read “W-I-N,” central bankers could pass out a button with “(C)BAD,” for “Central Bankers Against Deflation.”
All this points to a question: Exactly what is inflation, and how do we measure it? The correct answer is not at all obvious, though plenty of people think it’s obvious. They vigorously defend their chosen answers, too. Today we will consider some different inflation measures. None fully satisfies, but for a variety of reasons we actually do have to make the attempt to measure inflation. It is really very important to investors, savers, and people in general.
Always and Everywhere?
So what is inflation, and what causes it?
Milton Friedman famously said:
“Inflation is always and everywhere a monetary phenomenon.”
Those who quote the statement often omit the rest of Friedman’s sentence:
“… in the sense that it cannot occur without a more rapid increase in the quantity of money than its output.”
The rather famous research paper that Saint Friedman co-wrote clearly demonstrated the rather tight linkage between money supply and inflation. Except that the time frame over which the authors analyzed money supply and inflation was a rather stable period for the velocity of money. Irving Fisher’s equation (MV = PT), developed in the early ’30s, clearly demonstrated the relationship between prices and the velocity of money. Towards the end of his life Professor Friedman began to acknowledge the importance of the velocity of money in dealing with inflation.
That said, to describe inflation we must do more than just blame central bankers for a too-loose money supply. If the Fed, BOE, BOJ, and ECB had pushbutton control over inflation, don’t you think they would have pushed the button by now? The fact that they have not indicates that their control is not as complete as we sometimes think. The fact that three of the four above-mentioned central banks are worried about inflation being too low, even though their monetary policies are ridiculously easy, indicates that something else is going on. There are clearly other parts to the inflation equation.
Definitions of inflation vary a lot, but a basic definition that I like is that inflation is an artificial increase in the money supply that leads to higher prices for goods and services.
Do rising prices cause inflation, or are they symptoms of it? I think they are symptoms, but good people disagree on the underlying cause.


