When it comes to 2016, Goldman says that it is “deja vu all over again“, and that the S&P 500 index will tread water for a second consecutive year. Specifically Goldman says that its “year-end 2016 target of 2100 represents a 1% price gain from the current index level (2089), which itself is just 1% above the year-end 2014 level of 2059.”
Hardly the double-digit annual growth everyone has gotten used to over the past 7 years, that was so easy anyone could do it.
Here are the reasons why Goldman expects all the main themes from 2015 to be repeated in the coming year, and why the one can just sell on December 31, 2015 and go away for the next year:
In many ways our 2016 forecast is “déjà vu all over again.” The US stock market has mostly traded sideways during 2015 with the index hovering in a narrow band except for a brief late summer correction. Return dispersion across the market and within sectors has been low. Market breadth is currently at one of the lowest levels in 30 years. About 75% of large-cap core mutual funds is lagging the benchmark. The equity long/short hedge fund index has returned -2% YTD, trailing S&P 500 for the seventh consecutive year. About 75% of large-cap core mutual funds is lagging the benchmark. The equity long/shorthedge fund index has returned -2% YTD, trailing S&P 500 for the seventh consecutive year.
In terms of fundamentals, Goldman Sachs US Economics Research expects tepid GDP growth of 2.2% in both 2016 and 2017. We forecast S&P 500 earnings will rise by 10% to $120 per share in 2016 and by 7% to $129 in 2017 (see Exhibit 1). However, the headline EPS growth rate is misleading because it reflects a partial recovery in Energy sector profits after they collapsed by 80% this year in concert with the plunge in crude oil. EPS growth outside Energy will equal 8%. We expect flat net profit margins of 9.1% in 2016 and 2017.
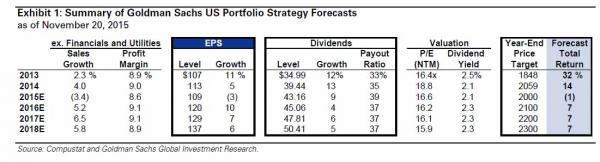
In terms of valuation, both the aggregate S&P 500 index and the median stock trade at the high end of a range of fair value based on most metrics. Our year-end 2016 index target of 2100 implies a P/E multiple compression of 8% to 16.2x our top-down 2017 EPS estimate, or 12% based on the bottom-up consensus earnings forecast. S&P 500 P/E multiple fell by an average of 10% in the 12 months following the start of prior tightening cycles. The typical S&P 500 constituent has a forward P/E of 17.2x, an EV/sales of 2.4x, an EV/EBITDA of 10.8x, and a P/B of 3.0x. Only 6% of the time during the last 40 years has the median stock traded at a P/E multiple higher than it does today.
In terms of money flow, corporate repurchases will remain the primary source of demand for US equities. Firms that have returned cash to shareholders via buybacks and dividends have outperformed for 25 years. The pattern was repeated this year and the trend will likely continue in 2016 given our muted equity return forecast (see S&P 500 cash spending trends: Investing vs. returning capital, November 6, 2015).
In terms of risks, uncertainties include (1) interest rate path different from our baseline assumption of year-end 2016 fed funds at 1.4% and 10-year bond yields of 3.0%; (2) global economic growth below our 3.5% forecast; (3) US presidential election; and (4) geopolitics.


