Trying to predict the end of economic cycles isn’t an easy game, but analysts at Morgan Stanley believe that they have some idea as to the date of the current bull market end.
In a research report published last week titled, Cycle Check-Up: How Will the Bull Market End? The bank’s leading strategists pull together the historical data to try and put together an end of cycle playbook for investors.
However, while the team believes that some features define the end of every cycle, they don’t think that the current cycle is likely to come to an end anytime soon as conditions remain favorable.
When Will The Bull Market End?
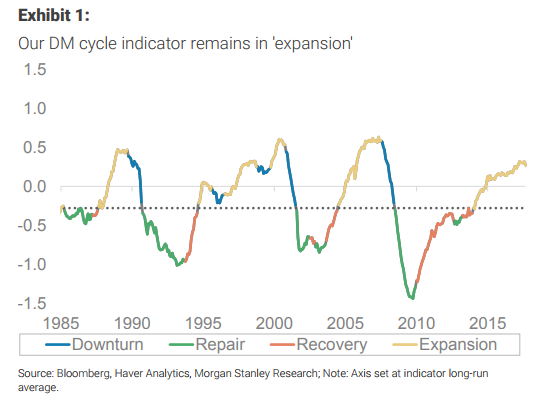
Morgan’s propriety ‘cycle indicator,’ which is based on the analysis of multiple economic data points, concludes that the current cycle still has room to run, but it is in the late stages. Still, this is positive for equities as they tend to outperform at towards the tail end of cycles:
“A late-cycle environment is usually good for equities. Looking at optimal portfolio allocations through the last 30 years, we find that the best portfolios during ‘expansion’ are equity-heavy (but HY-light), suggesting that a high allocation to stocks is still warranted as long as the cycle is intact. In fact, unsurprisingly, there’s a strong cyclical pattern to optimal allocation: exposure to stocks is highest in early cycle (‘repair’), falls as the bull market ages, and troughs in ‘downturn’; allocation to bonds goes the other way.”
The big question is: how will the bull market end?
Based on the analysis of past cycles, Morgan’s analysts point to the three “X’s” that tend to cause trouble around late-cycle “eXtreme leverage build-up, eXuberant sentiment and eXcessive policy tightening.”
Trying to determine if any of these risks are present today, is not easy. For example, there’s some evidence of excessive leverage in the corporate sector, but overall the US is much less levered than it was before the 2008 crisis. The ratio of US aggregate debt/GDP has trended sideways for the past two years as the fall in public, household and GSE leverage has been more or less offset by an increase in corporate debt. (As shown in the chart below, a doubling of government debt is almost entirely responsible for the growth in overall debt levels) .


