We’ve got a new week on tap so let’s get started with a review of my key market models/indicators and see where we stand. To review, the primary goal of this exercise is to try and remove any subjective notions about what “should” be happening in the market in an attempt to stay in line with what “is” happening in the markets. So, let’s get started.
The State of the Trend
We start our review each week with a look at the “state of the trend.” These indicators are designed to give us a feel for the overall health of the current short- and intermediate-term trend models.
Executive Summary:
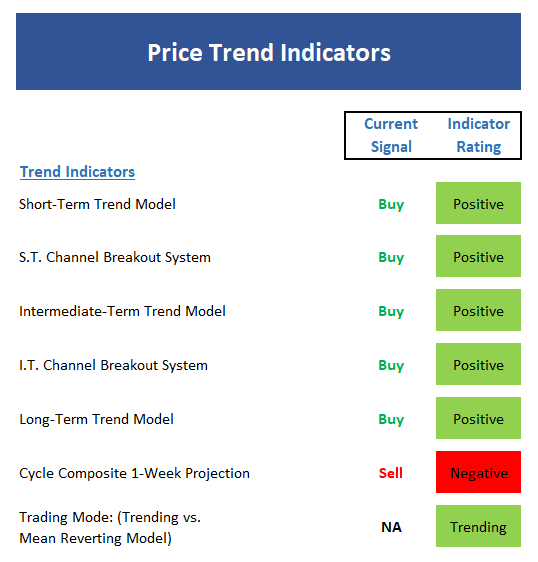
Hate to sound like a broken record here, but with the S&P 500 closing at yet another all-time high on Friday, it is not surprising to see all of our Trend Models positive this morning.
Both the short- and intermediate-term Channel Breakout System indicators are positive again this week.
The long-term Trend Model continues to sport a bright shade of green.
Although the Cycle Composite has been out of sync with the market moves since mid-August, the composite points lower for the next two weeks.
We probably don’t need anything but a chart to tell us this, but all three Trading Mode models agree that this remains a trending environment.
The State of Internal Momentum
Next up are the momentum indicators, which are designed to tell us whether there is any “oomph” behind the current trend.
Executive Summary:
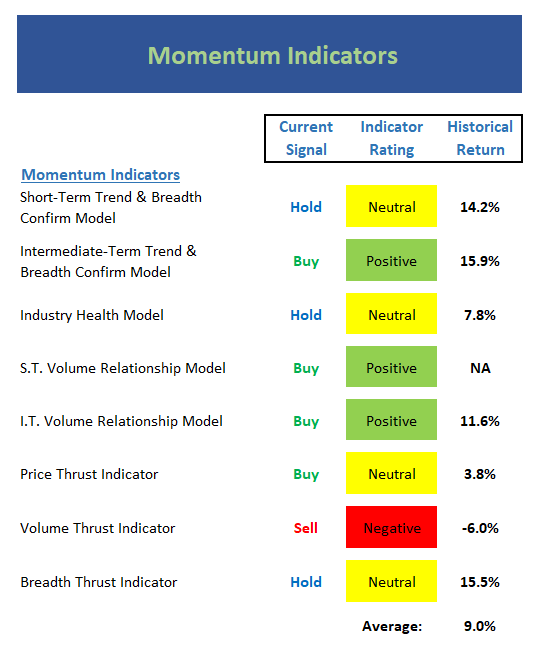
The short-term Trend and Breadth Confirm Model slipped to neutral last week. This should be viewed as a warning sign that momentum is waning on the upside.
Our intermediate-term Trend and Breadth Confirm Model, which has done a very good job staying with the overall trend, remains positive.
The Industry Health Model remains at the high end of Neutral. However, we should note that this model has been unable to move into the outright positive zone during this cycle. As such, I’m not going to worry about the status of this indicator.
The reading of our short-term Volume Relationship model is positive, however, the trend of up volume is heading the wrong way at this time.
A similar story is being told by the intermediate-term Volume Relationship model. The model itself is positive, but the trend of demand volume has now turned down from a short-term perspective.
The Price Thrust Indicator remains on a buy signal but the indicator reading has slipped to neutral. Since the indicator is an oscillator, this simply means that the most recent buy signal is becoming “stale.”
Not surprisingly, the Volume Thrust Indicator remains negative.
The Breadth Thrust Indicator is in the neutral zone to start the week.
There has been a subtle shift in the status of the momentum board – and I view this as a potential yellow flag that the bulls may be tiring from their big run this year.
The State of the “Trade”
We also focus each week on the “early warning” board, which is designed to indicate when traders might start to “go the other way” — for a trade.
Executive Summary:
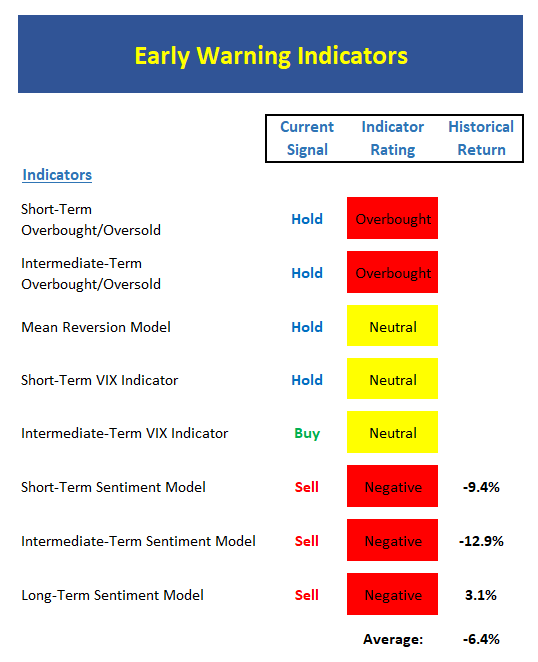
From a near-term perspective, stocks are once again overbought. But, the fact that stocks have not been able to become oversold since mid-August should be viewed as a sign of strength.
From an intermediate-term view, stocks remain VERY overbought. But again, this appears to be a “good overbought” condition.
The Mean Reversion Model starts the week in the neutral zone but is moving closer to a new signal.
The short-term VIX indicator is very close to issuing a fresh sell signal – for a trade.
Our longer-term VIX Indicator, which remains on a very timely buy signal, has reversed and is now in position to issue a sell. But not yet.
From a short-term perspective, the market sentiment model has flip-flopped between negative and neutral of late. This week, the model is back in the red – by a slim margin.
The intermediate-term Sentiment Model has not wavered and remains negative.
Ditto for the longer-term Sentiment reading – solidly red.
The key takeaway here is the “early warning” board is starting to look like the 3rd grader in the back of the room that knows the answer and desperately wants to be called on.
The State of the Macro Picture
Now let’s move on to the market’s “external factors” – the indicators designed to tell us the state of the big-picture market drivers including monetary conditions, the economy, inflation, and valuations.
Executive Summary:
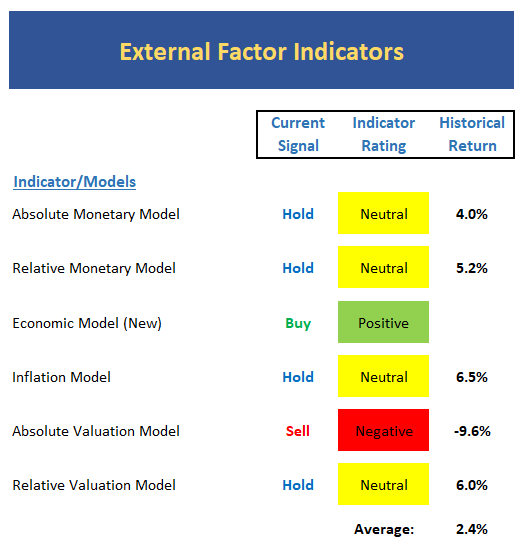
Absolute Monetary conditions continue to weaken as our model declined to the lowest level of the year.
While in better shape than the absolute model, the Relative Monetary Model is also neutral.
Our new Economic Model, which now indicates the status of economic growth continues to suggest the economy is doing just fine, thank you.
The Inflation Model remains stuck in the neutral zone and continues to suggest that inflation pressures are miniscule at the present time.
The Absolute Valuation Model hasn’t budged and remains solidly red.
Our Relative Valuation Model remains neutral but is heading in the wrong direction here.


