Greetings all, from my recent post regarding Oil where I expressed my view that we could see an important top soon and a pullback, today I have more signs increasing the chances that the high is already in and that price has started the anticipated the reversal. However, there is still no confirmation. Confirmation will come with the break below $54 – $53.75.
1st sign
Impulsive wave down.
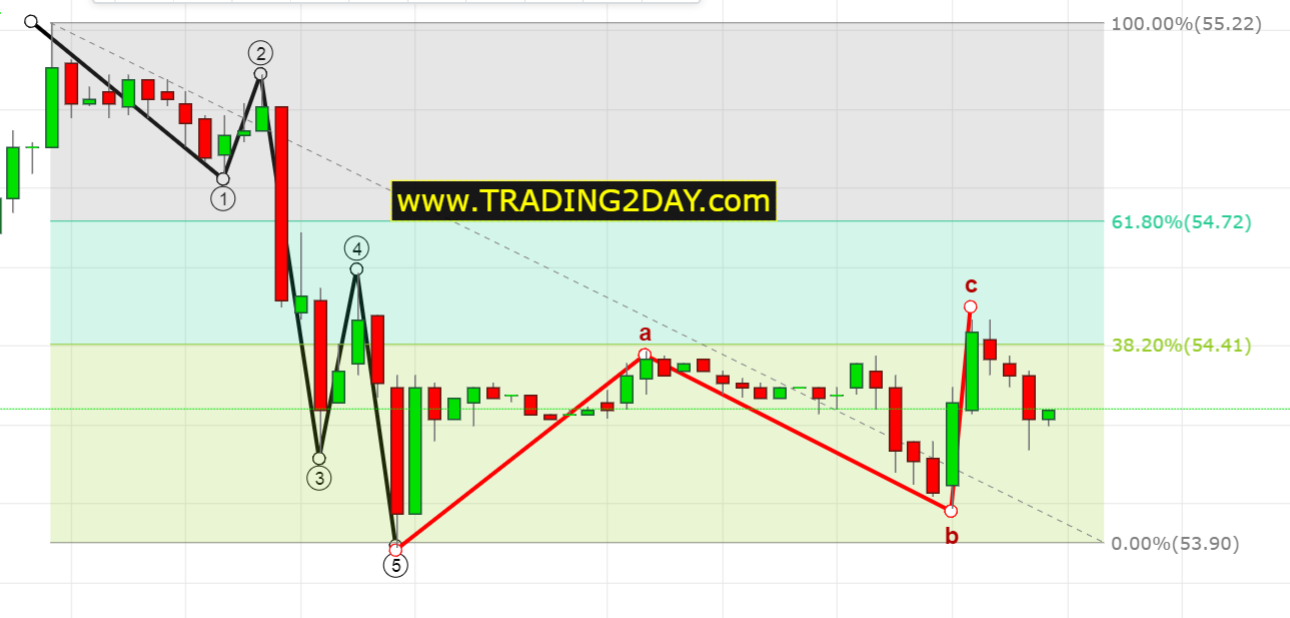
30-minute chart. 5 waves down. Corrective bounce towards 38% Fibonacci retracement and previous 4th wave so far. Breaking to new lows is more probable than seeing new highs above yesterday’s high. Important support is at $53.89.
2nd sign
Another H&S pattern
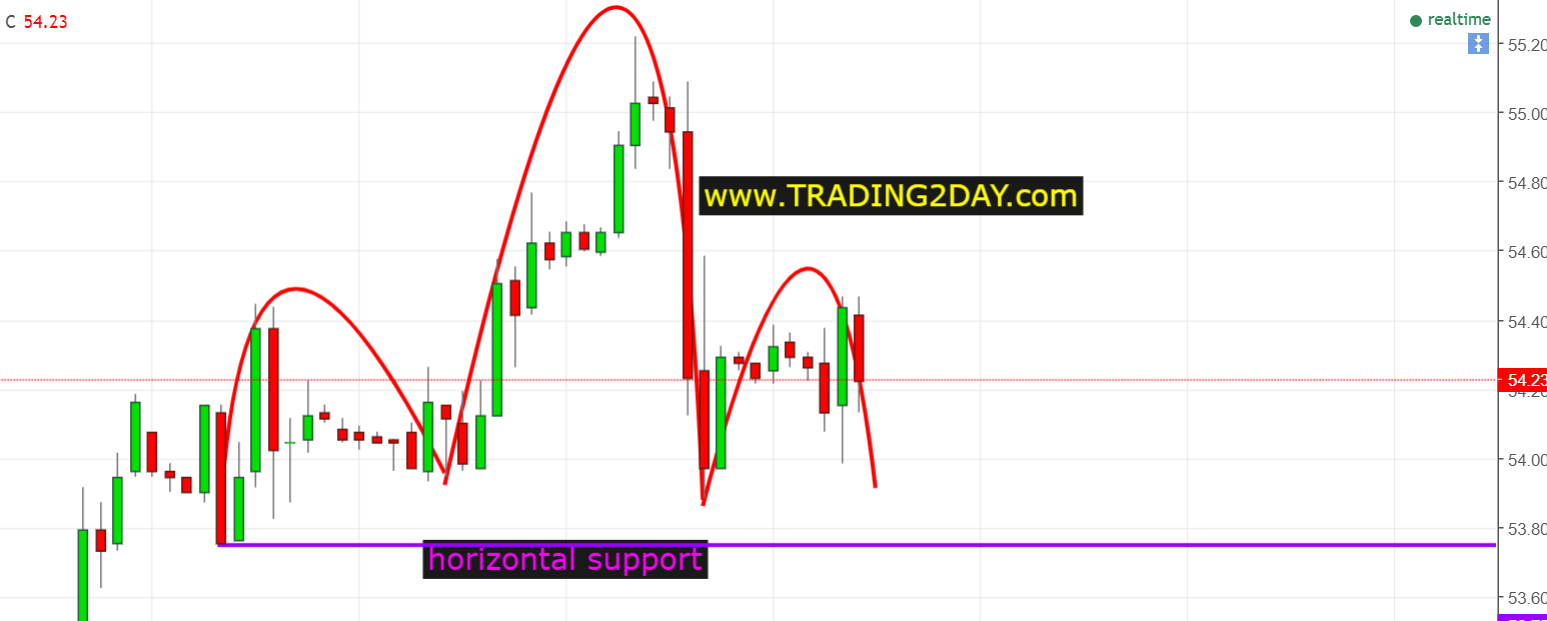
Another H&S pattern could be validated once the neckline and support at $53.85 – $53.75 breaks. Target would be equal to the height of the head.
A common denominator in both cases the importance of the support at $53.90 – $53.75. If this support fails, prepare for a move towards $53 at least.
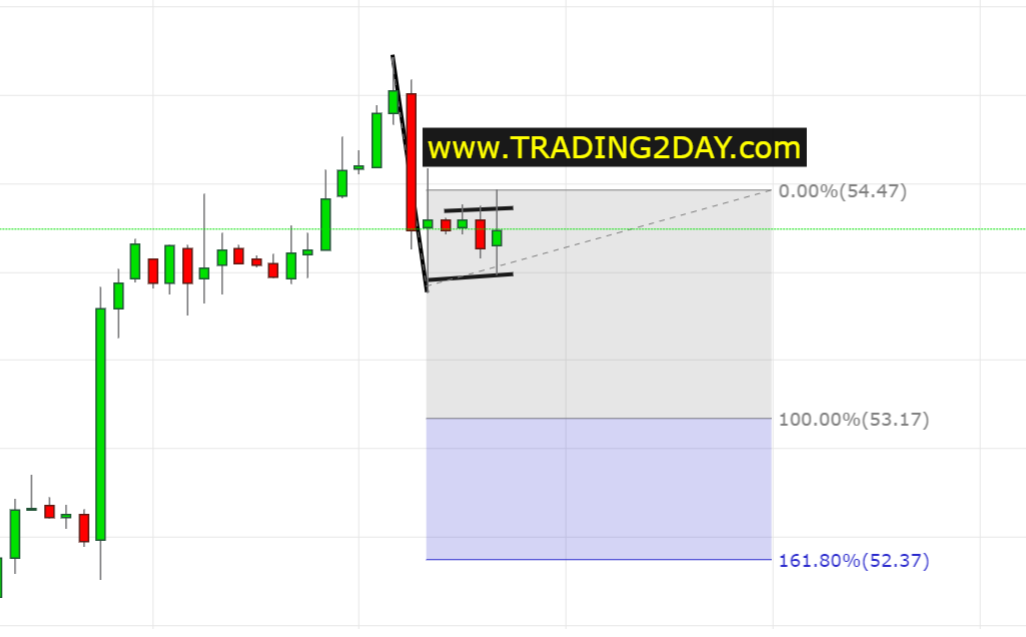
The Ichimoku cloud support is found at $52.85 – $52.40. Daily support at $50.50 very important. Also, keep this level in mind. We will come back if 4-hour support fails to hold.
I’m already short on since yesterday from $54.72.


