Shinzo Abe was elected to a second term as Japanese Prime Minister in 2012 and launched his three arrows plan to revive the Japanese economy. The three arrows were:
The second arrow – fiscal policy – has not had much of an impact beyond increasing the government debt/GDP ratio. The third arrow of structural reform at the corporate level has been, in my opinion, the most successful of the three arrows. For the first time in decades, corporate Japan is focusing more on profits and return on equity than just increasing market share. But what I want to talk about today is the first arrow – currency devaluation.The Yen actually started to weaken in the run up to Abe’s election in December of 2012. The yen was around 78 Yen/Dollar in August of 2012 and fell to almost 124 by the summer of 2015.Note: A weakening Yen is more Yen per dollar so the Yen is strengthening when the line is falling and weakening when it is rising.(Click on image to enlarge)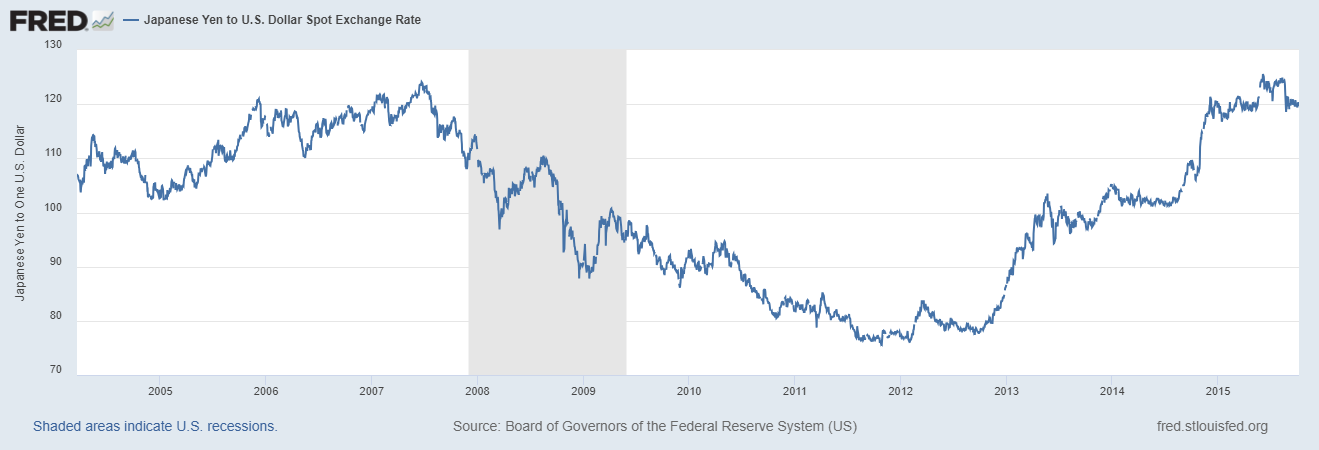
The aim of the devaluation was to “escape” deflation which had persisted since (at least) the turn of the century. From 2000 to 2012, the Japanese inflation rate averaged -0.28%:(Click on image to enlarge)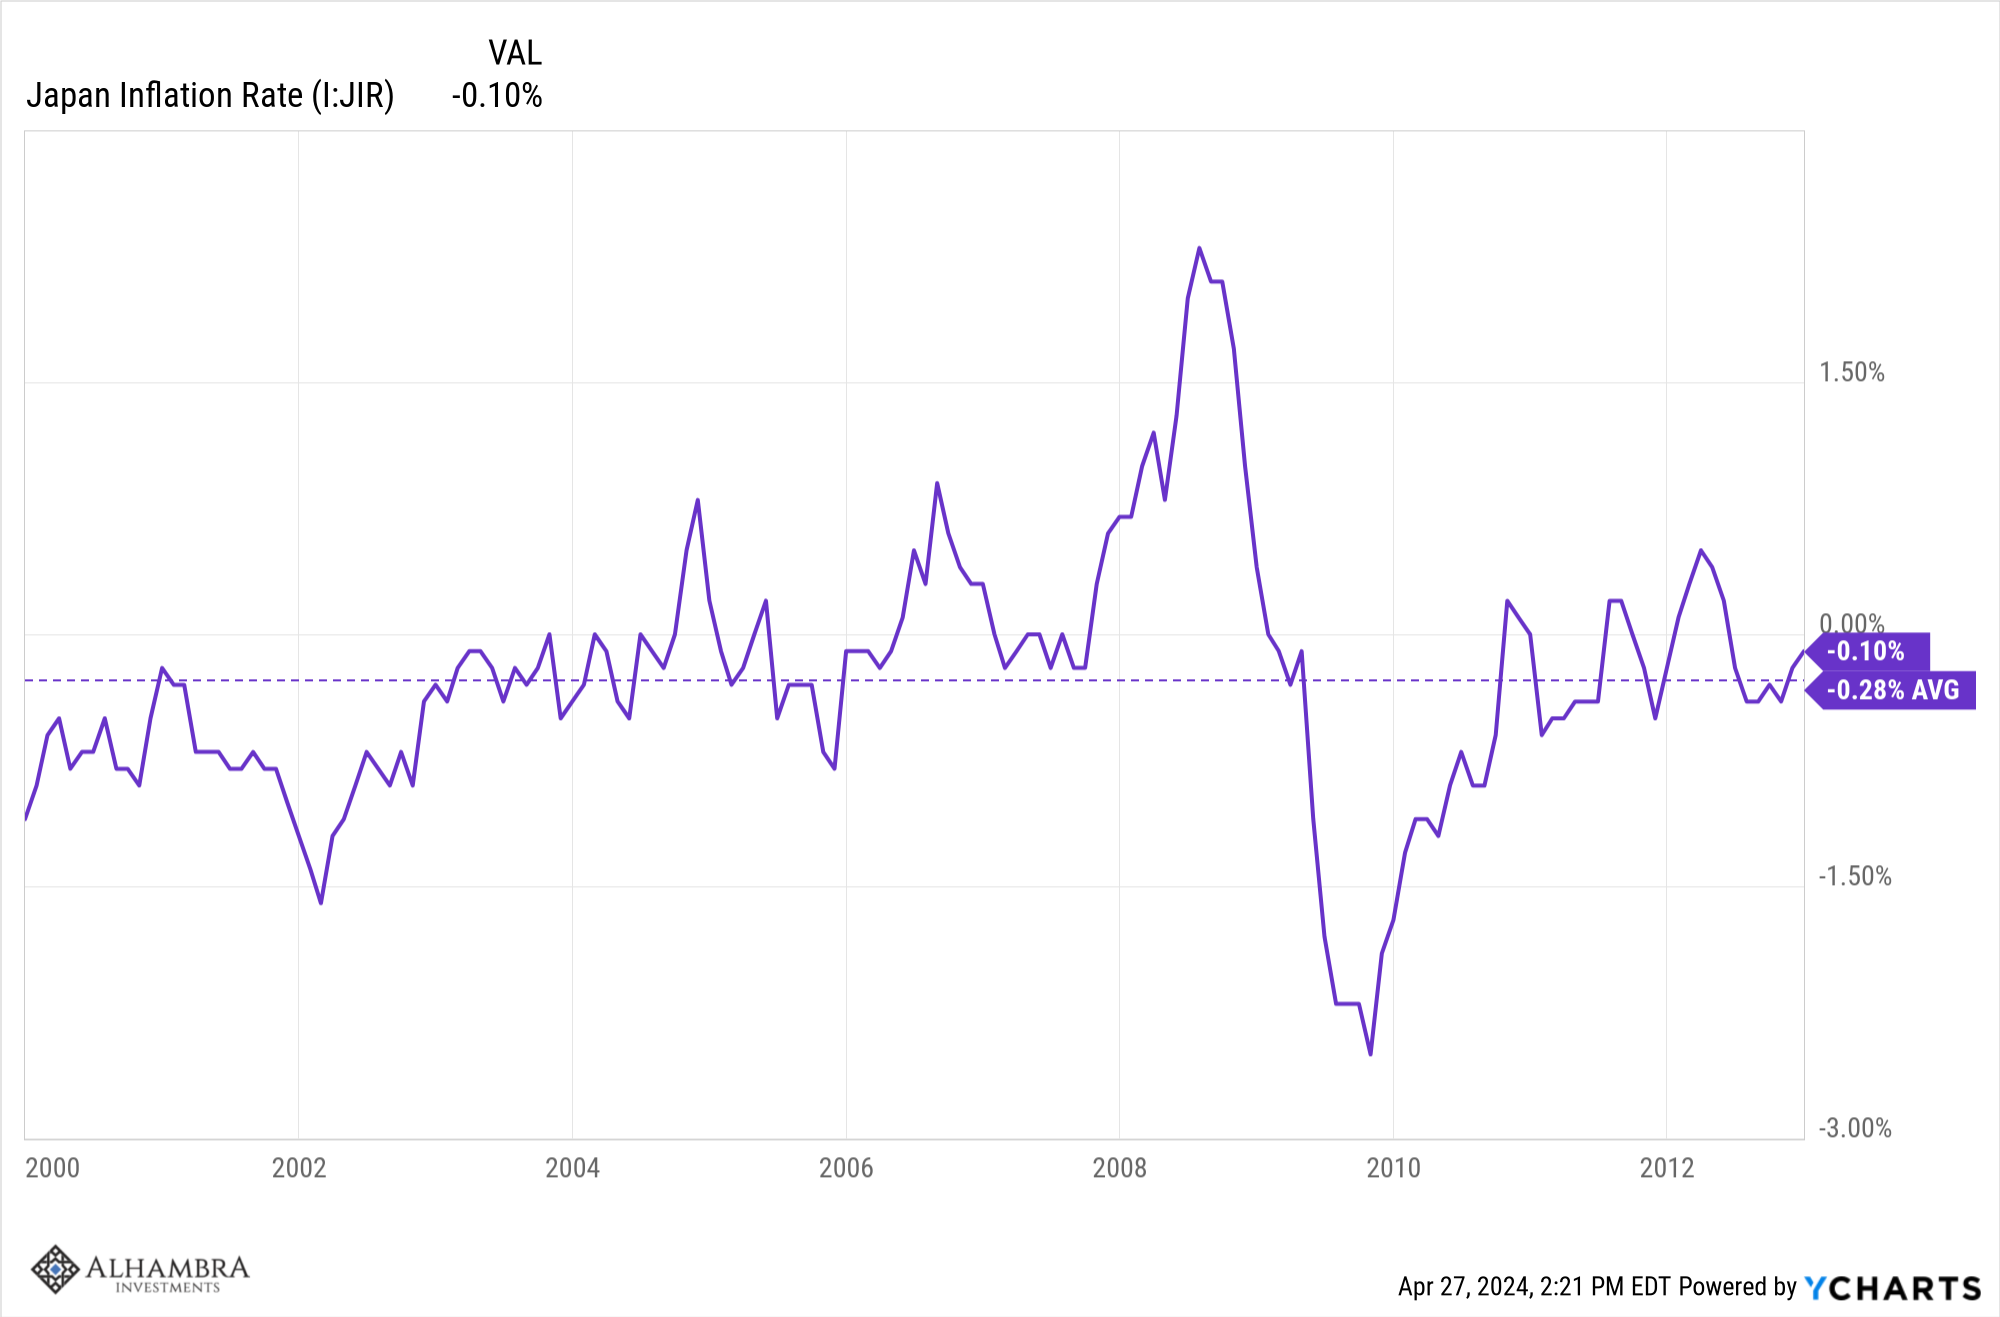
The Yen was likely overvalued in 2000 at 102 when the PPP (purchasing power parity) was around 150 (IMF, see ), an overvaluation of nearly 50%. By 2012, the Yen was 76 and PPP was about 104 so the overvaluation wasn’t as bad but still substantial. Although there are other causes, the strong Yen was at least part of the reason for the deflation of that decade and weakening it surely seemed a simple solution to a complex problem. After the Abe reforms were launched, the Yen did depreciate, as mentioned above, to around 124 in 2015. With PPP at 103.5, the Yen was now undervalued. That overshoot was corrected fairly quickly and from 2016 to 2020, the Yen traded right around its PPP and was probably fairly valued. The Yen started to weaken in 2021 as the BOJ ramped up Yen printing again to help the economy recover from the COVID shock. They weren’t as obvious this time about wanting a weaker Yen but their policies certainly got that result.Did the devaluation work to relieve the deflation? Well, yes and no. Inflation did spike higher after the initial devaluation, rising to an annualized 3.4% by April of 2014, but by the end of 2015 inflation was back down to 0.2% and the average from 2012 to 2015 was a mere 1.3%. Still, it wasn’t deflation so by that measure, mission accomplished. But as the yen rose again and stabilized from 2016 to 2020, inflation once again fluctuated around zero, averaging just 0.3% during those years. After the Yen started to devalue again in 2021, inflation rose, reaching 4.3% in January of 2023. How much of that was due to the weaker Yen and how much due to supply chain issues and the Ukraine war is hard to say. The latest inflation reading was 2.7% in March of this year. The average since 2020 is 1.8% and so, I guess, mission accomplished again.(Click on image to enlarge)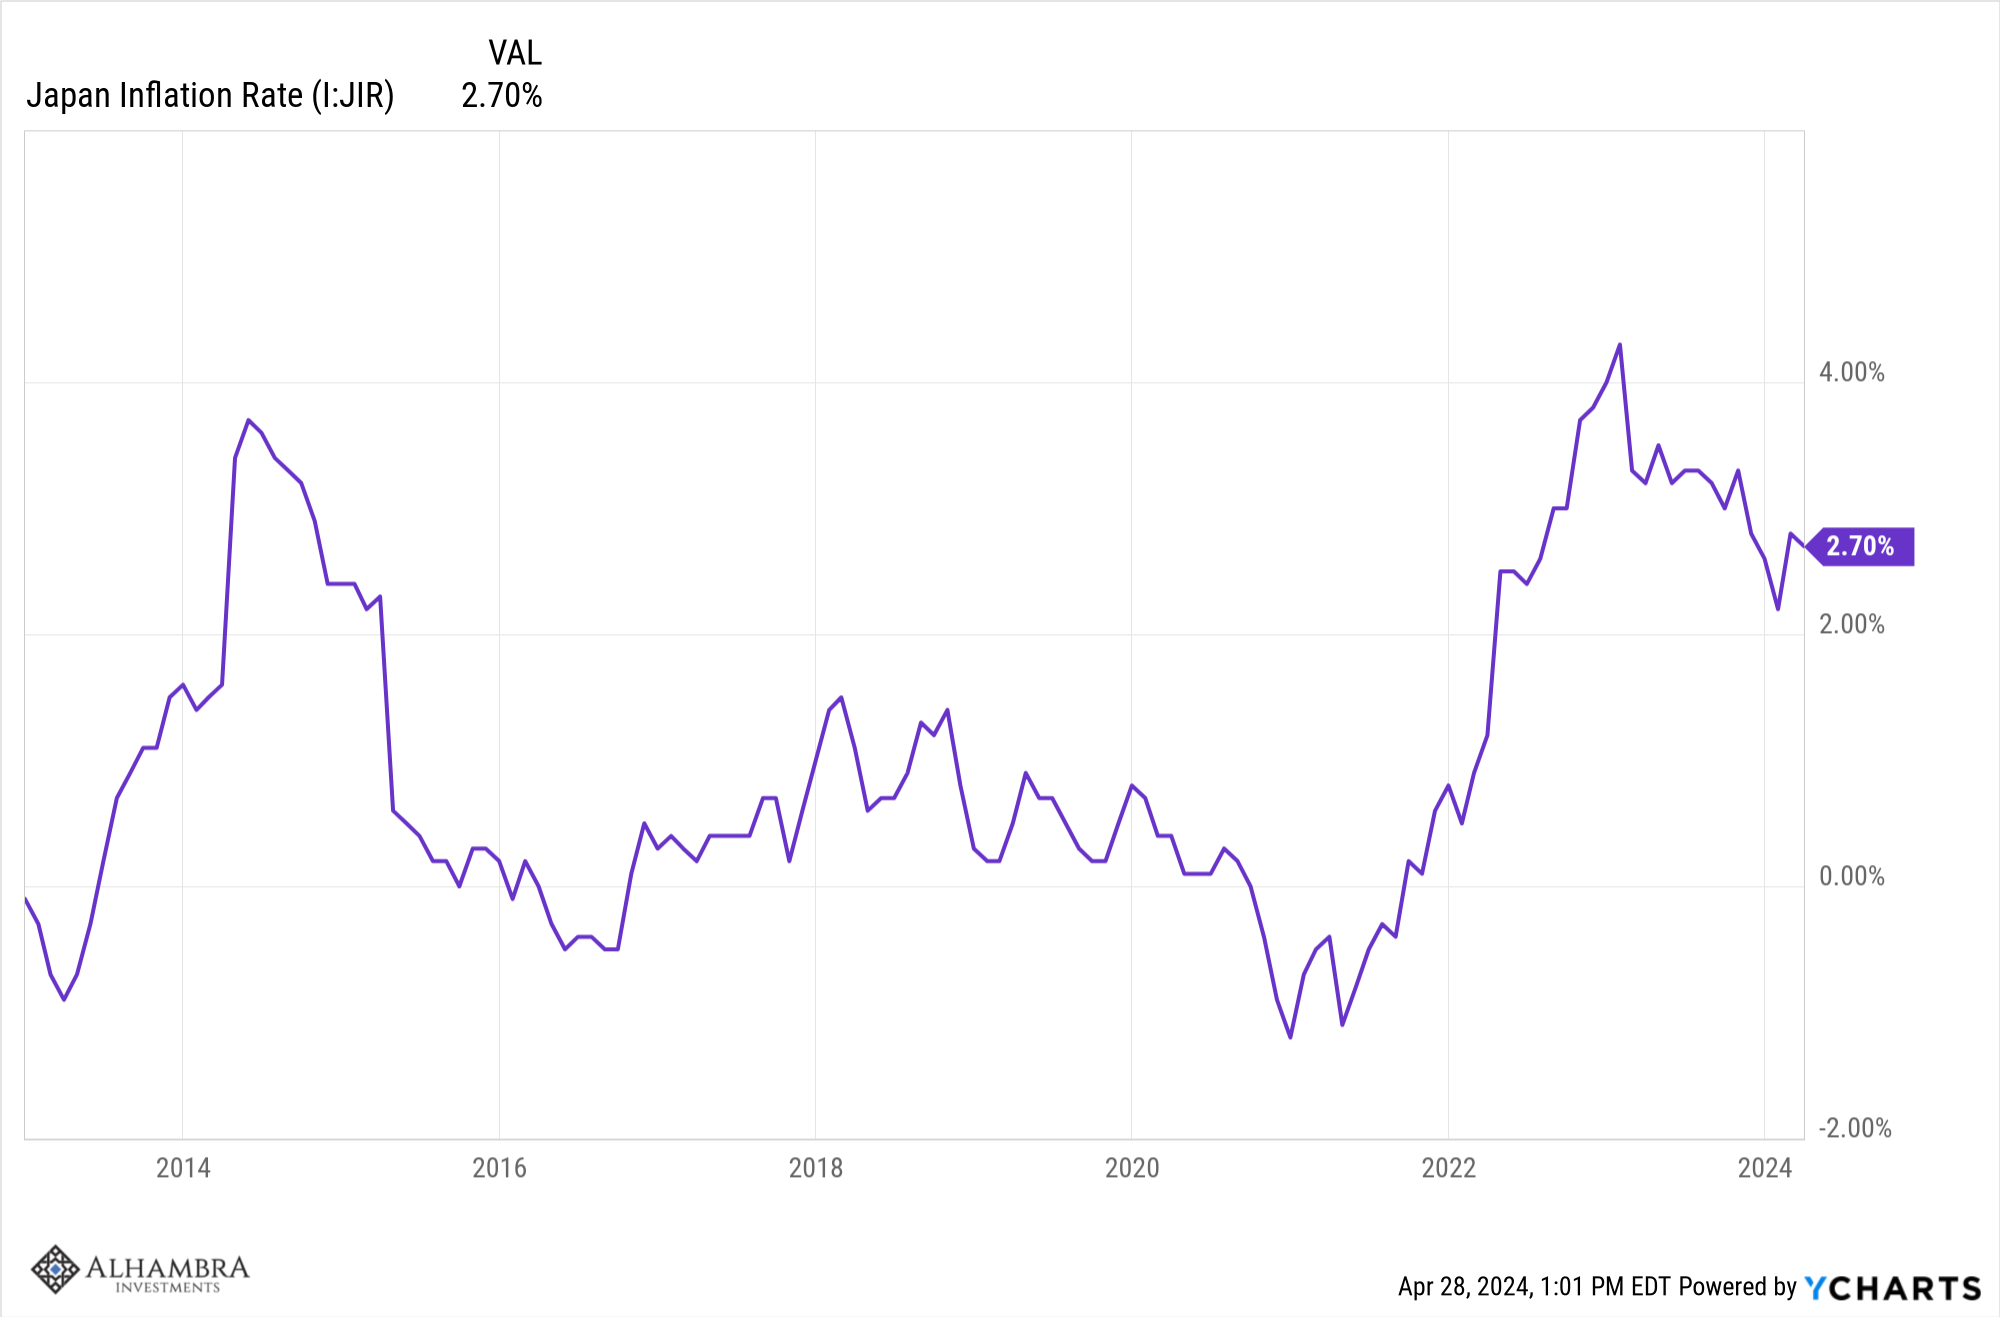
The problem is that the Yen is now drastically undervalued again, at about 157 last week, with a PPP of roughly 90. There are no free lunches in global economic policy so if the BOJ won’t raise rates, the market will sell Yen until they do or it reaches a level that is attractive enough for outside investors to take the risk of further devaluation. Apparently, we aren’t there yet because the decline is becoming disorderly.(Click on image to enlarge)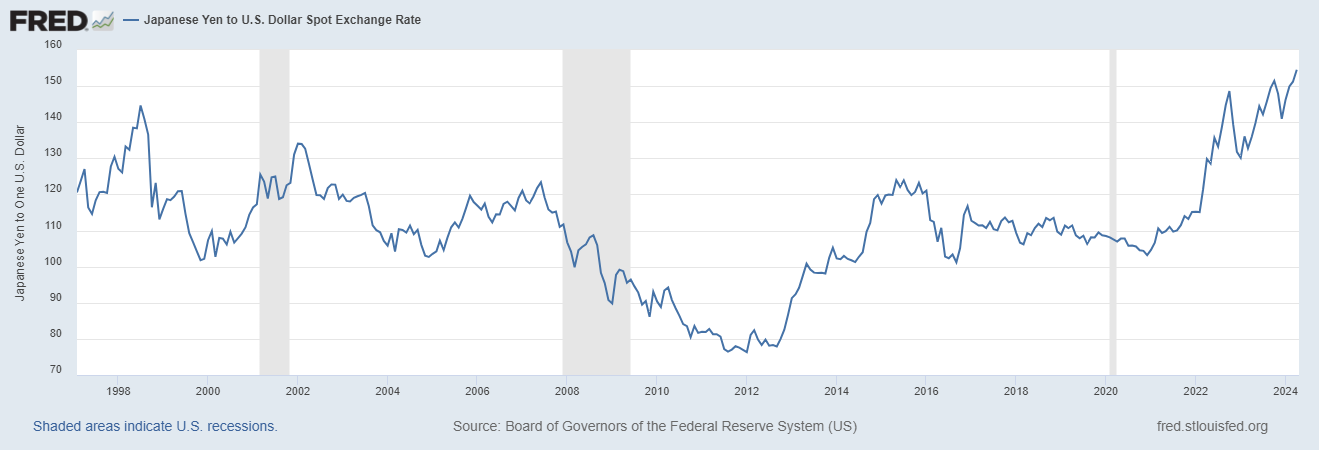
Has currency devaluation worked? I suppose that depends on how you define success. If the goal was merely to get more inflation then devaluing the Yen was a qualified success. If the goal was to increase economic growth – which was the stated aim of the Abe reforms – then it has been a miserable failure. For the 13 years before the reforms, the average year-over-year change in Japan’s Real GDP was 0.76%. From 2012 to today, the average is 0.70%. Okay, if you stop measuring before COVID, the average to the end of 2019 was 0.9% which is somewhat better. The average from 2022 to today is 1.4% so the performance in the post-COVID world is a little better.(Click on image to enlarge)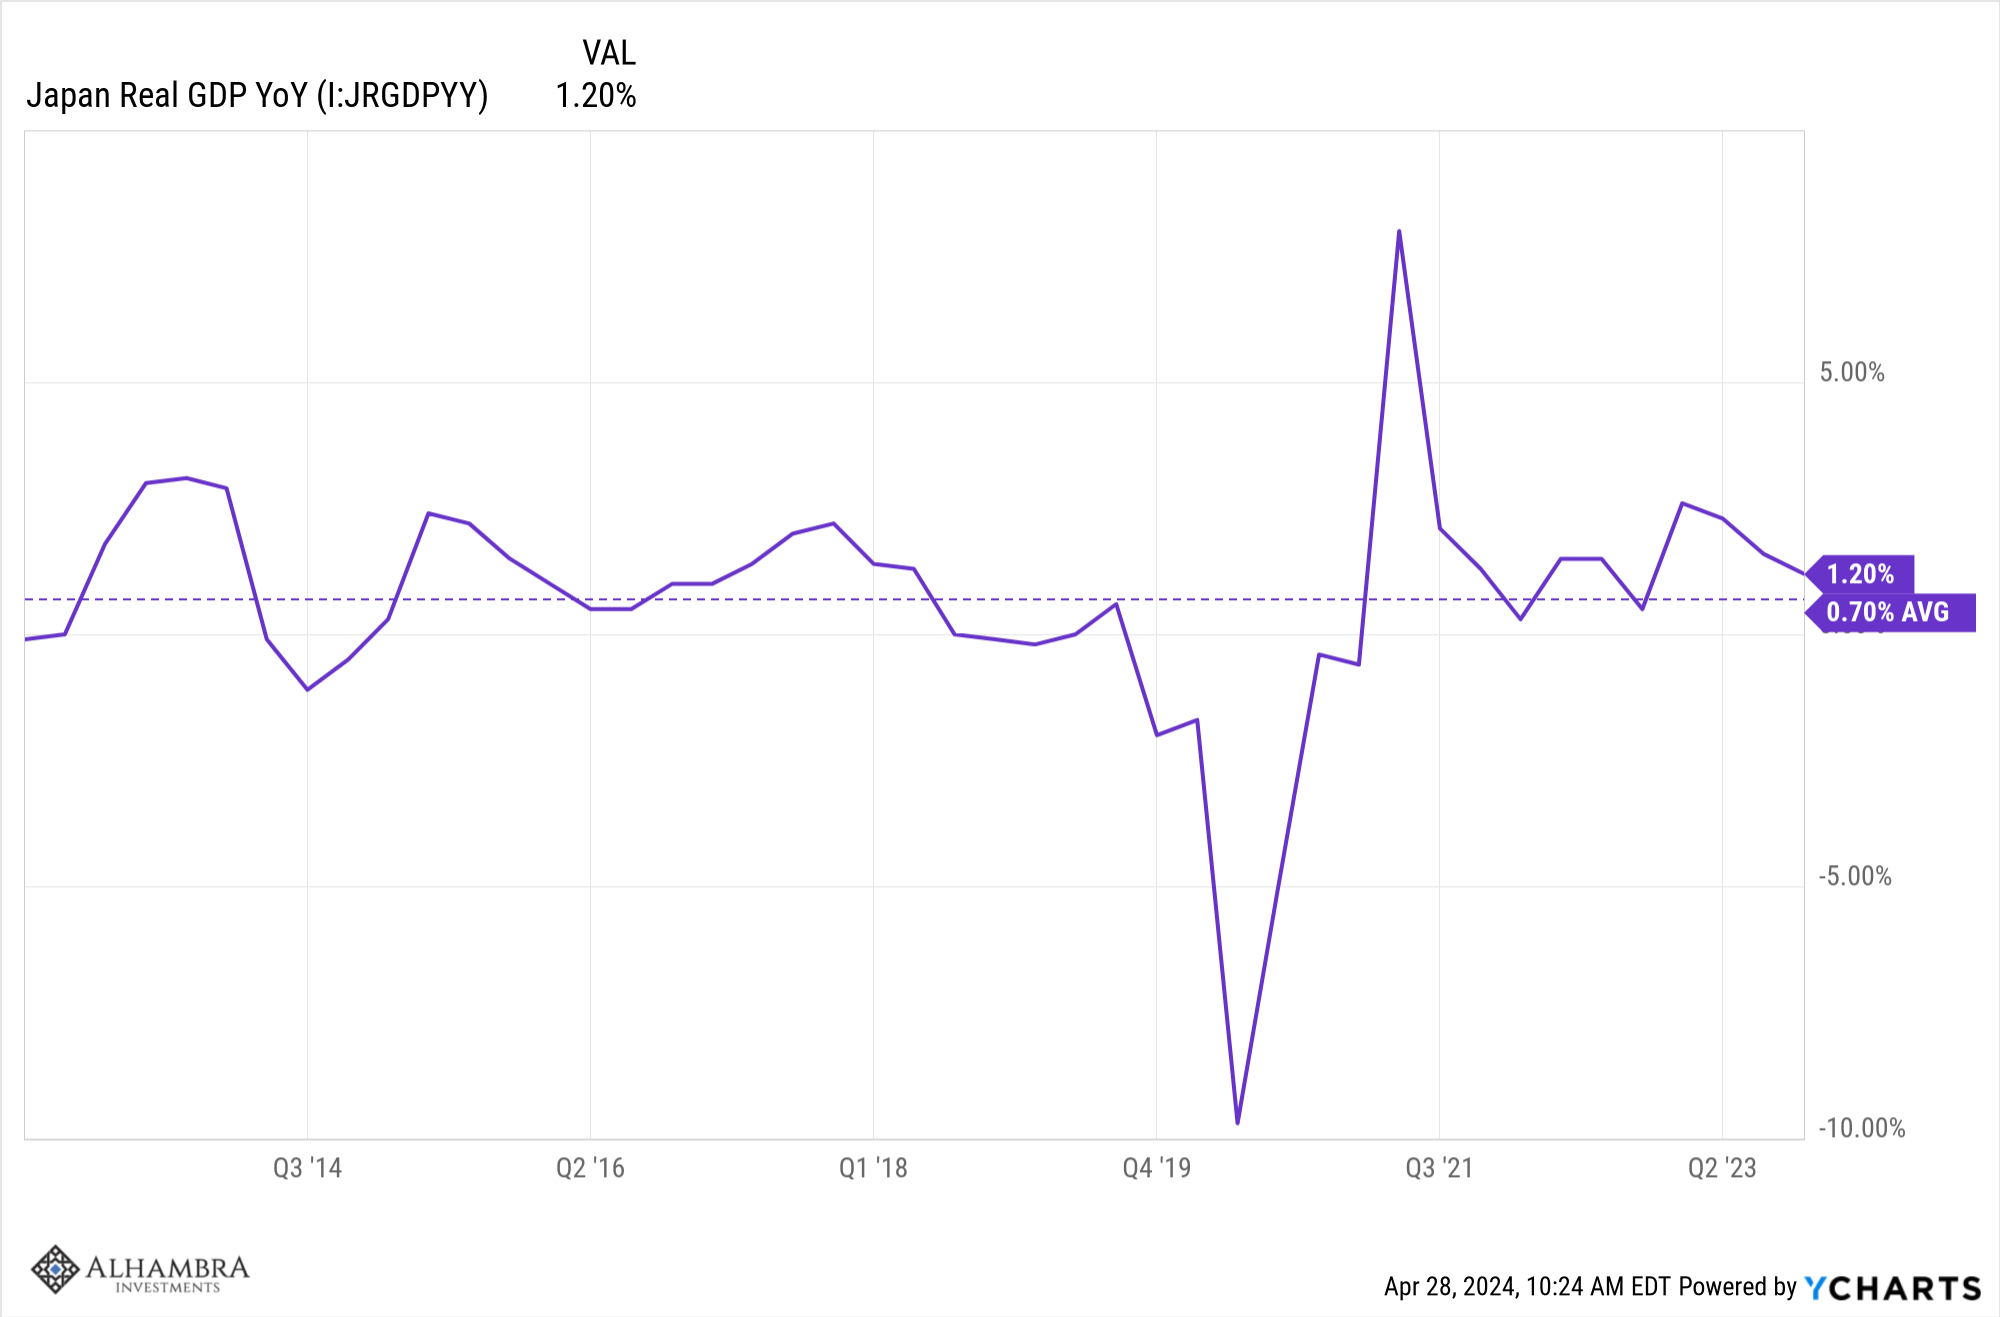
But the picture is considerably different if you convert GDP to dollars. In current dollars, Japanese GDP was $6.3 trillion in 2012, and in 2023 it was $4.3 trillion. It would be hard to call that success.(Click on image to enlarge)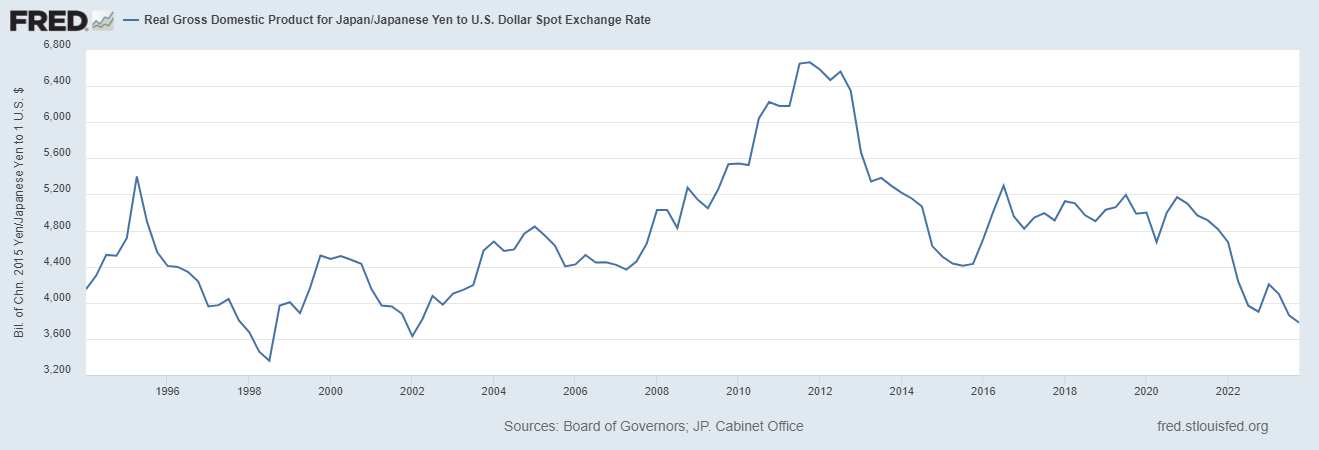
Currency devaluation has been somewhat positive for Japanese exports and it has directly boosted tourism:(Click on image to enlarge)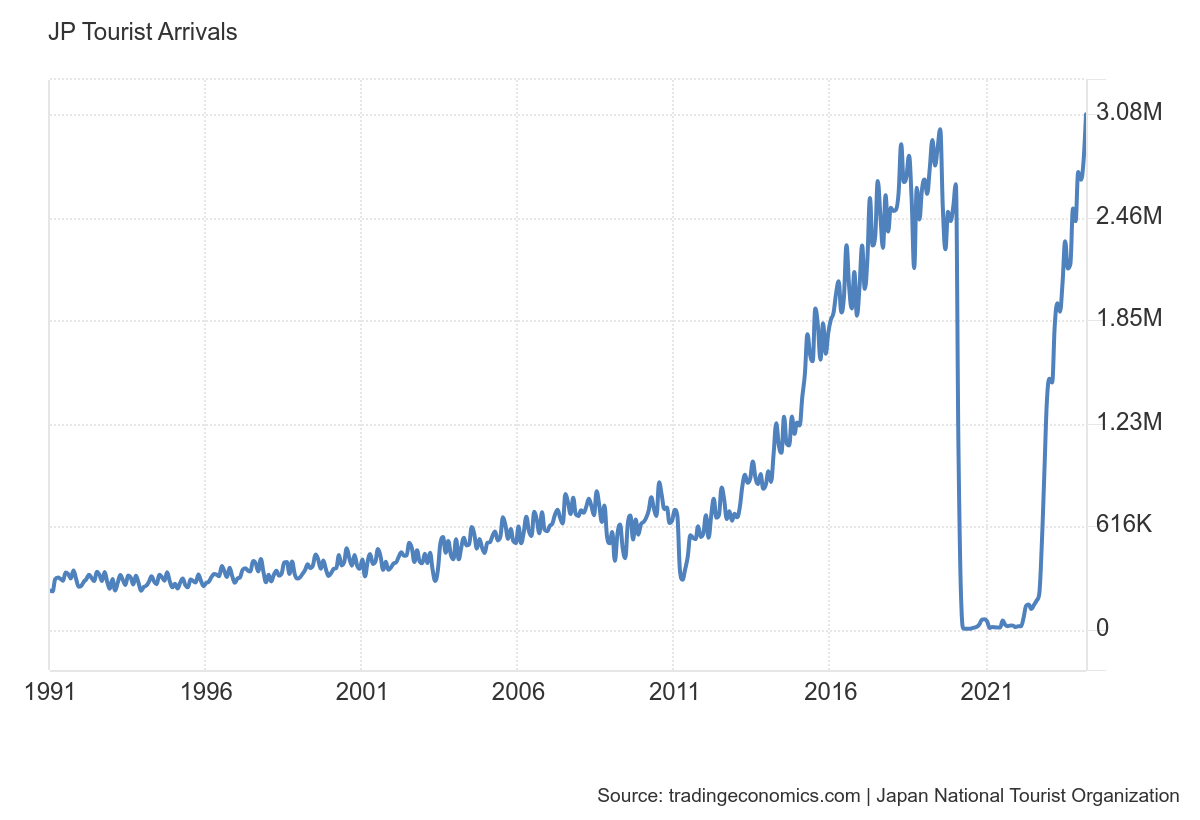
But the reduced value of the Yen also raises the price of imports and in a country with few natural resources (energy especially), that is a big problem. Of course, a lot of Japanese companies are multinationals but non-Yen sales only represent about 40% of revenue for the companies in the TOPIX index (about 43% for the S&P 500). The reason I said above that the third arrow of structural reform was the most successful is seen in corporate profits. From the 1960s to 2012, Japanese corporate profits averaged about 3% of sales. Since 2012, the average is up to about 5.5% and the latest reading is nearing 7%. As a % of GDP, ordinary profits (which include interest expenses) have risen from 7.75% prior to the reforms to 13.5% today . Dividends have also risen considerably from 1.7% of GDP from 1990 to 2012 to 4.2% of GDP today. Some of that was due to increased profitability and some due to higher payout ratios. A lot of the improvement in the corporate sector is due to the fact that during the “lost decades”, corporate Japan deleveraged which reduced interest expense. But some portion of the reduced interest expense is also due to the BOJ keeping interest rates pegged at basically zero for over a decade.In addition to the rising cost of imports, there is the question of what the Yen does from here. What will the BOJ – and potentially other central banks – do about the Yen? Japan is the largest holder of US Treasuries with about $1.3 trillion and could theoretically sell those to buy Yen and support its value. The only problem is that selling them would likely raise US interest rates making the dollar that much more attractive relative to the Yen. In other words, they might be able to hold the Yen up for a while but it would ultimately go lower still.The other option is to raise Japanese interest rates. That is the best solution and I believe Japan’s economy, like the US economy, would function better with higher rates. And with reduced leverage in the private sector I don’t think the domestic economic impact would be as great as the BOJ obviously fears. But there are concerns beyond just higher interest costs on Japanese government debt. Would higher Japanese interest rates induce Japanese investors to sell non-Yen bonds (US Treasuries for instance)? Would higher Japanese interest rates push US rates higher?What would be the impact on Japanese insurance companies and banks who own about a quarter of outstanding JGBs? As a firm, we invested in Japan over a decade ago because of the structural reforms and it has been a good investment. But the recent acceleration of the Yen devaluation has me concerned about the fallout. Japan has plenty of foreign reserves so it isn’t Thailand, which kicked off the Asian Crisis 25 years ago. But currency volatility has been the source of global instability in the past and there are almost always unexpected outcomes. The Asian crisis, for instance, was the root cause of the failure of Long Term Capital Management, which was a long ways from Bangkok. Currency devaluation never accomplishes what its proponents believe it will. And it often causes friction with trading partners, an outcome the Japanese should be very familiar with. The Plaza Accord in 1987, to raise the value of the Yen (or lower the value of the dollar, however you want to look at it), was an attempt to reduce the US trade deficit that didn’t work but led directly to the Japanese bubble of the late 80s. The Louvre Accord, which attempted to stabilize the dollar after the devaluation forced by the Plaza Accord, was certainly a catalyst for the popping of that bubble and the lost decades that followed. Currency manipulation is a political act aimed at a domestic audience but with global implications.Two recent articles about the economic policies of a potential future second Trump administration highlights the risks. Some of his advisors, including the Trade Representative in his first term, Robert Lighthizer, are openly advocating for a devaluation of the dollar due to what they see as unfair trade competition from a cheap Yen and Yuan. Other advisors are floating proposals to impose political input on monetary policy with the President having a say in setting interest rates. Trade tariffs haven’t worked because they are the economic equivalent of an own goal. They don’t fix the problem – assuming you see a trade deficit as something that needs fixing – and they raise prices. They lead to corruption (crony capitalism) as domestic concerns seek exemptions from the tariffs and are fairly easy for foreign producers to evade (China is doing so right now). And when tariffs inevitably fail, you get proposals to devalue the currency and make monetary policy a tool of politicians. I’m sure there are worse economic policy ideas but I can’t think of any right now. The Japanese have spent the decades since their 80s bubble popped trying to find a set of policies that will restore their glory days. They’ve spent massive piles of Yen on infrastructure (sound familiar?), the central bank has bought boatloads of government bonds (sound familiar?), and now they’ve devalued the Yen. They are also reviving their failed industrial policies of the old MITI in an effort to recapture market share in an industry they once dominated – semiconductors (sound familiar?). Our current and potential future political leaders seem to think that the reason Japanese economic policies have failed is because they weren’t implemented by Americans. Is Japan finally due for a comeuppance about excess government debt, ineffectual fiscal policies and failed industrial policies? Since the late 1990s, everyone who has tried to short JGBs (Japanese government bonds) has been carried out on a stretcher; there’s a reason it is referred to as the widowmaker trade. Maybe no longer. Note: Some of the data cited in this post comes from GMO’s white paper from October of 2023, Japan, Land of the Rising Profits. They are obviously bullish on Japan for many of the same reasons I was for the last 12 years but I think they are late to the party. How they view the current Yen devaluation I have no idea. We are currently moving away from a direct investment in Japan in favor of a more diversified international approach.
Environment
(Click on image to enlarge)
The 10-year Treasury yield traded in a 17 basis point range last week which used to be a pretty big range, but was a tame week compared to some we’ve had recently. In the end, the rate only rose by 5 basis points. The short and intermediate-term trend for the 10-year rate is still up.(Click on image to enlarge)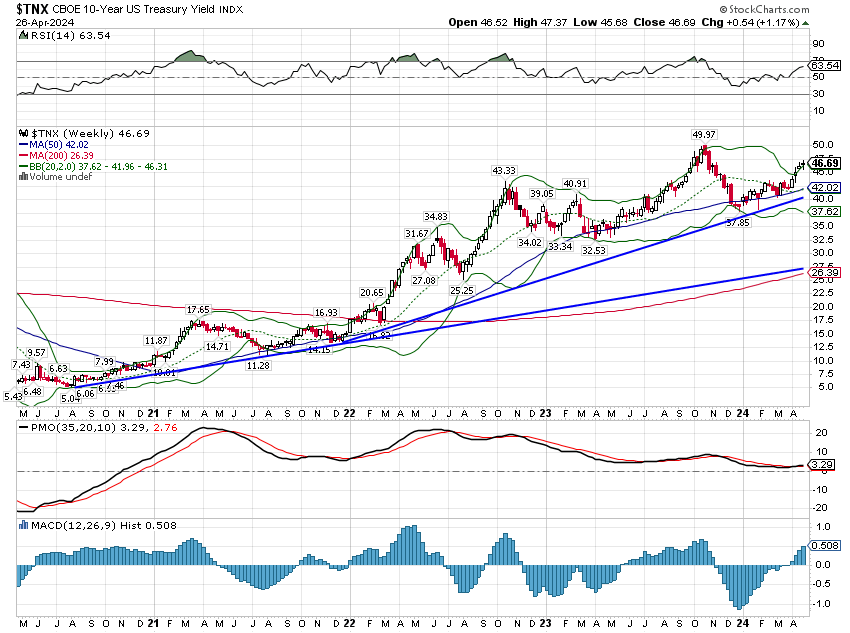
The dollar was down a tad last week but no trends have changed. I am somewhat surprised at the dollar index’s failure to rally with the tailwind of a rapidly weakening Yen but other currencies, like the Euro at 107, have kept the dollar in check.(Click on image to enlarge)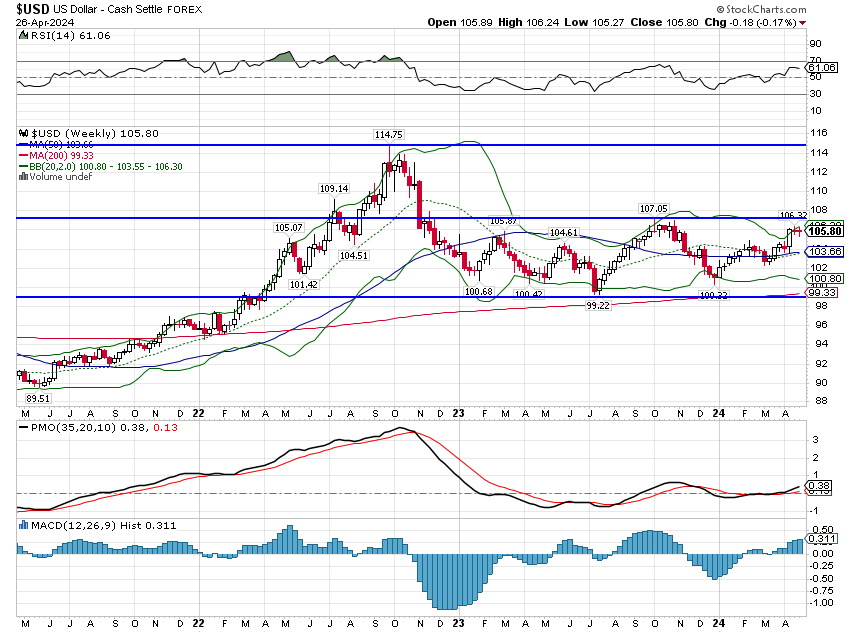
Markets
From the high Wednesday to the low Thursday, the S&P 500 traded down almost 2% and it looked like we were about to get another down leg in this correction. The catalyst was the GDP report for Q1 24 which showed a slow down in growth and inflation higher than expected. The headlines on those reports were the worst part of them, though, and the market spent all of Thursday afternoon coming back. The PCE inflation report on Friday seemed to calm things and the market ended up over 2% for the week.Growth led the way last week but the gap between large growth and large value is closing YTD. Mid and small value is already outperforming YTD and over the last 3 years. Small value is also now outperforming over the 5-year period and midcap value is very close. This shift to value has been choppy and kind of under the radar but it is happening.If the dollar does eventually drop, whether due to market forces or government direction, international stocks are likely to outperform. That, like the value transition, may already be starting to happen with non-US stocks up nearly 10% over the last year.(Click on image to enlarge)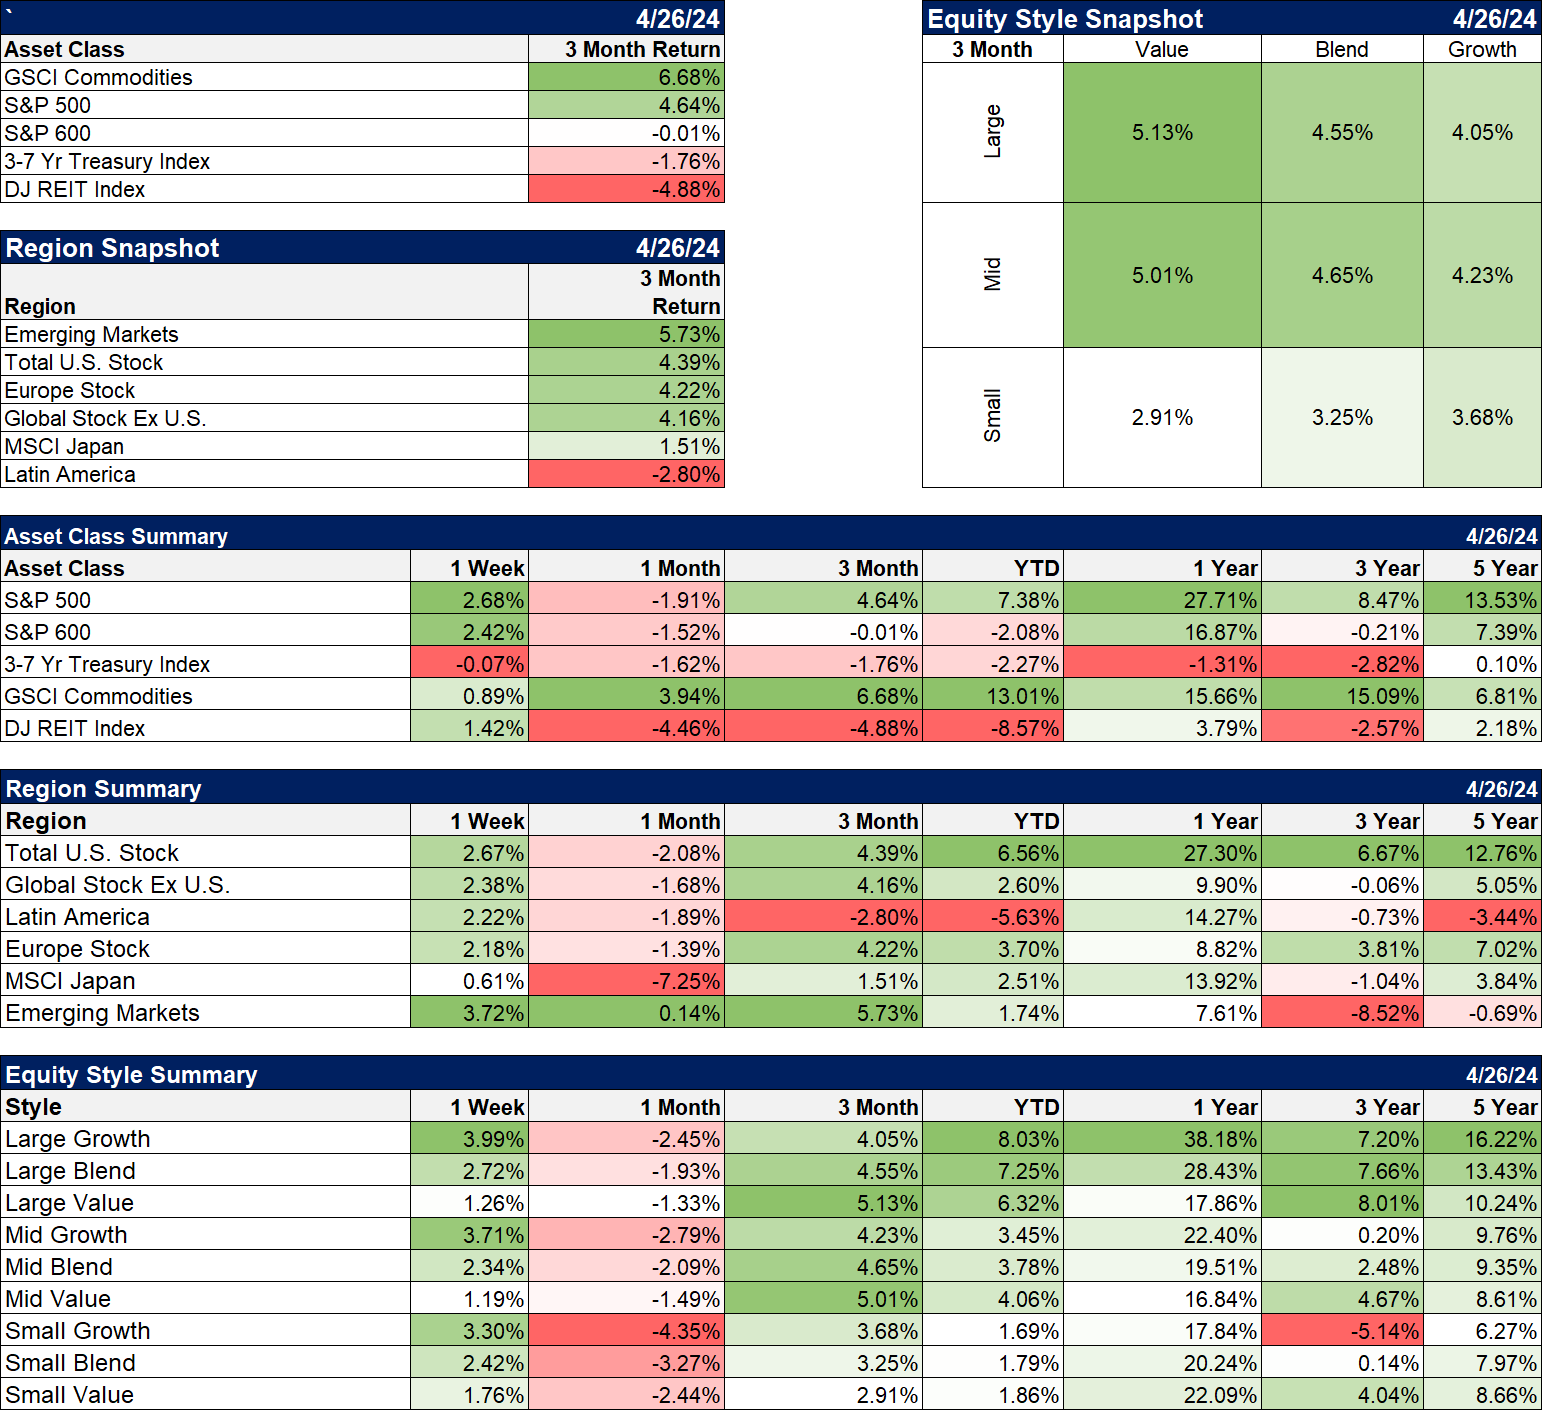
Sectors
Cyclicals and technology were the leaders last week but energy continues to lead YTD. Energy stock returns over the last 5 years are only exceeded by technology.(Click on image to enlarge)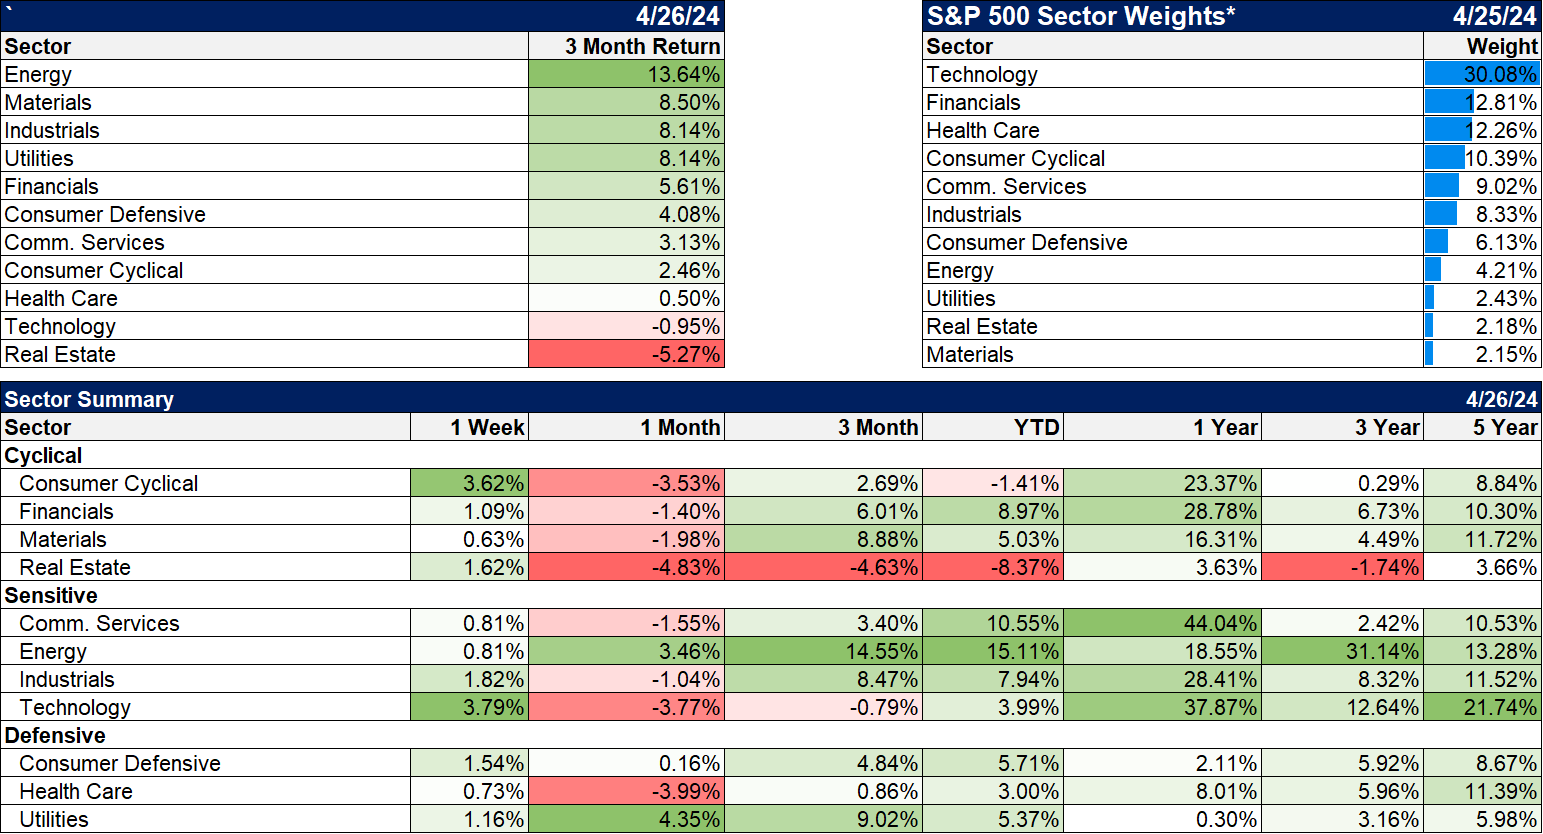
Market/Economic Indicators
Mortgage rates have moved back above 7% but that didn’t stop new home sales and pending home sales from rising in March. The spread between mortgage rates and the 10-Year Treasury rate continues to narrow. (Click on image to enlarge)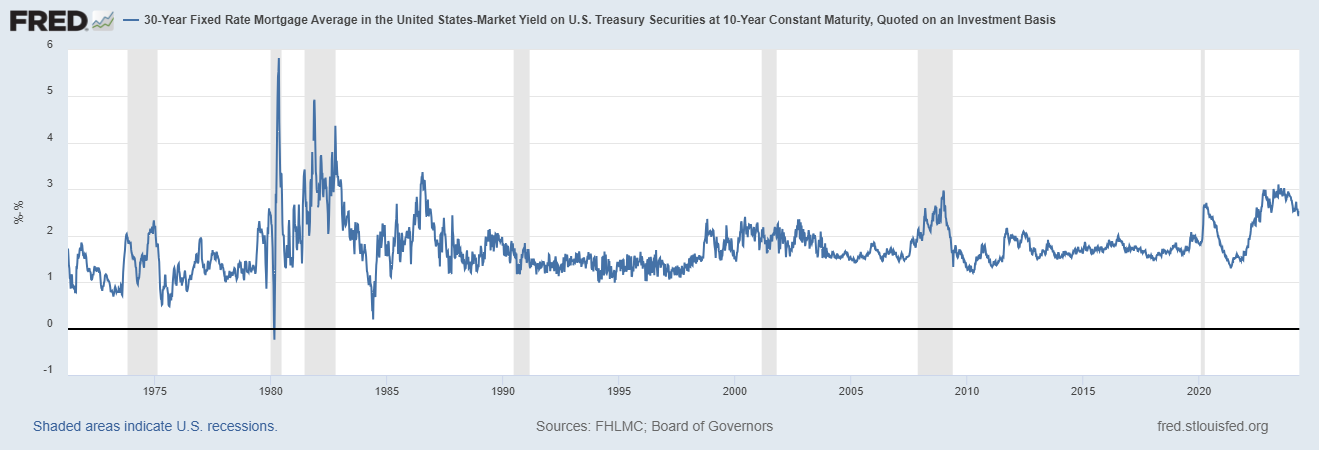
Major economic reports last week:
(Click on image to enlarge)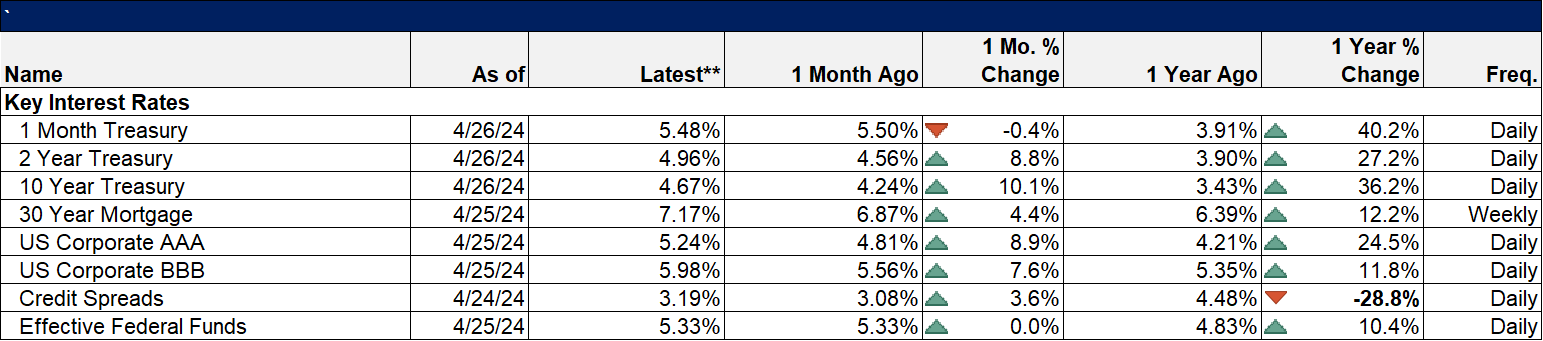 Weekly Market Pulse: Situation NormalAre Higher Interest Rates Good For The Economy?Market Morsel: Cash And Carry


