This is an update of some information I last posted several months ago.Real median household income is one of the best measures of average Americans’ well-being, but the official measure is only reported once a year, in September of the following year.So right now the most recent official measure is for calendar year 2022 (when you might remember gas prices surged to $5/gallon). In other words, it’s hopelessly out of date.There are several ways of approximating real median household income on a more timely basis available in the public data. For this purpose, wages are a very imperfect proxy, because income includes things like stimulus payments or debt relief during the pandemic, and also because – especially during the pandemic – layoffs were concentrated among low wage workers, thus distorting the averages higher.The best proxies make use of personal income. We can also get information from total payrolls. The below graph shows both real personal income (blue) and real aggregate payrolls (red), both divided by population. Here’s the data starting before the pandemic:(Click on image to enlarge)
And here is the close-up after the end of pandemic-related stimulus payments:(Click on image to enlarge)
The big difference between the two is that real payrolls only include wages and salaries, while real incomes includes all sources of income, including stimulus payments and things like social security. Thus real per capita payrolls declined sharply during the fist months of the pandemic and did not recover until late 2022, while incomes soared due to the pandemic related programs. Further, real payrolls stalled during 2022, while real incomes per capita actually declined.Since late 2022, both measures have consistently increased. Additionally, a few private services have been able to use monthly data from the survey that gives rise to the jobs report to create a far more timely and illuminating monthly update. The best of these that I know of is Motio Research.Here’s , through March:(Click on image to enlarge)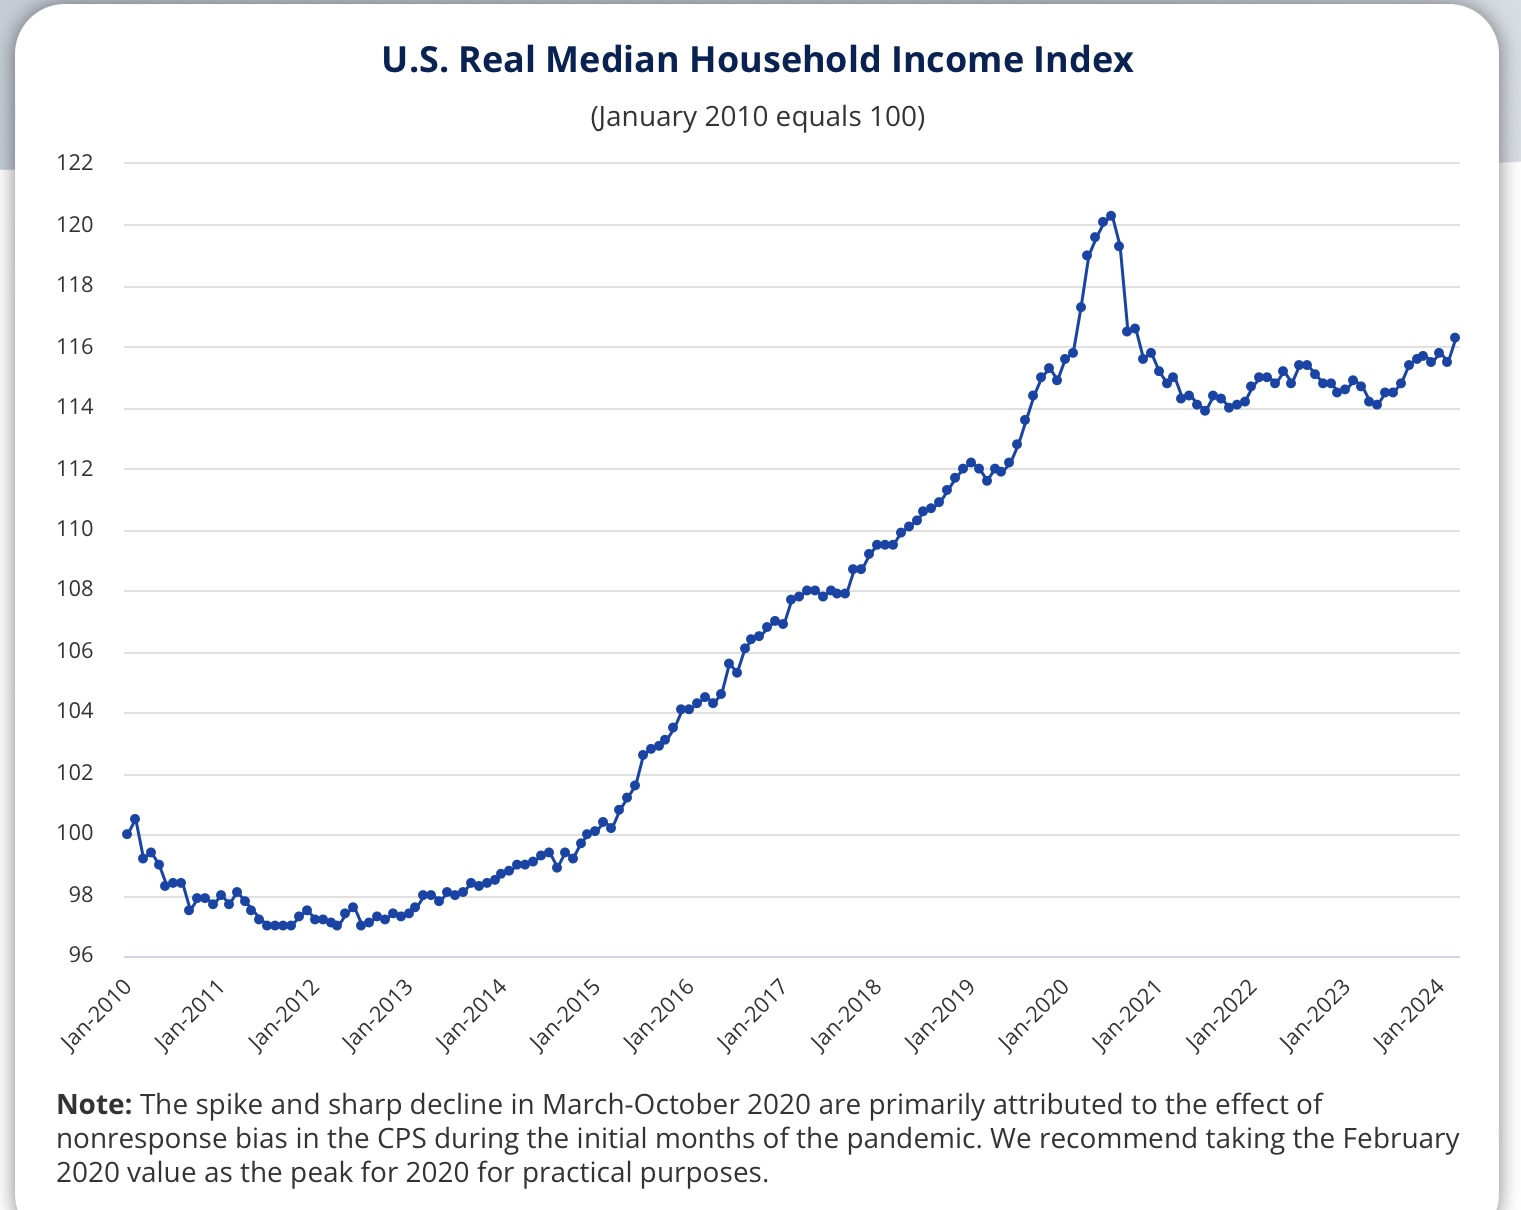
Like personal income, household income really spiked with the pandemic relief programs in 2020. It then went nowhere for almost three years, stuck at the same level it had been in 2019. Again, like personal income, that’s because of the spike in inflation, and the fact that jobs and real payrolls didn’t return to their pre-pandemic levels until 2022 and 2023 respectively.The one remaining puzzle is why real *median* household income declined again into mid-2023, vs. *average* personal income, which increased. One explanation might be the expiration of pandemic stimulus and relief programs, although I would expect that to show up in the broader income measure.Some light can be shed by looking at *median* wage growth, as documented by the Fed:(Click on image to enlarge)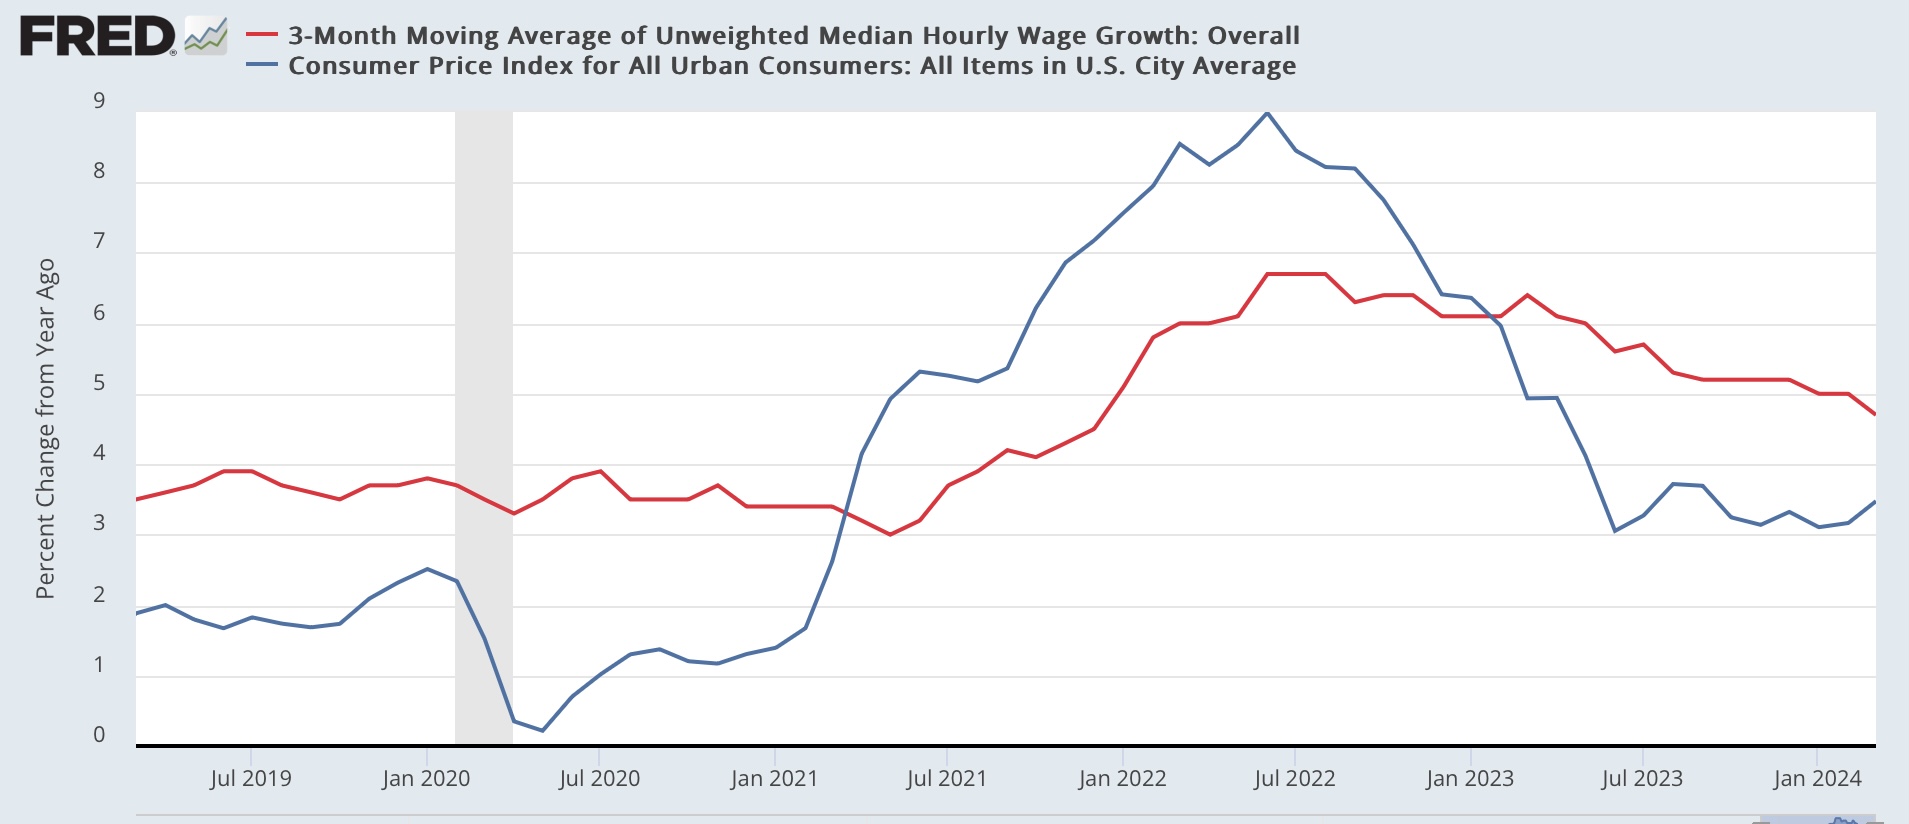
Note that, compared with inflation, median (rather than average) wages continued to decline until early 2023. Another important explanation is likely that income growth has been concentrated among the lowest quintile of households. In connection with the latest annual update, wrote:
While overall household wealth in America fell from the end of 2021 through the first three quarters of 2022, the bottom 20% of households by income saw their wealth grow.
“In total, household wealth for the lowest-income quintile rose by nearly 10% while wealth in all other income quintiles fell, according to figures from the Federal Reserve and nonpartisan data center USAFacts.
Here is the accompanying graph:(Click on image to enlarge)
This very much helps explain why Biden’s approval ratings have been so poor throughout 2022 and 2023.But, to return to the Motio Research graph, note that since last June, the trend has been rising again, and in March real median household income reached its highest level ever except for the 2020 stimulus months. What this means is that, if real household income growth had been concentrated among the lowest quintile through 2022, by mid-2023 it had spread upward to include the median group as well, and with some fits and starts this growth has continued.Which is good news for the average American household.


