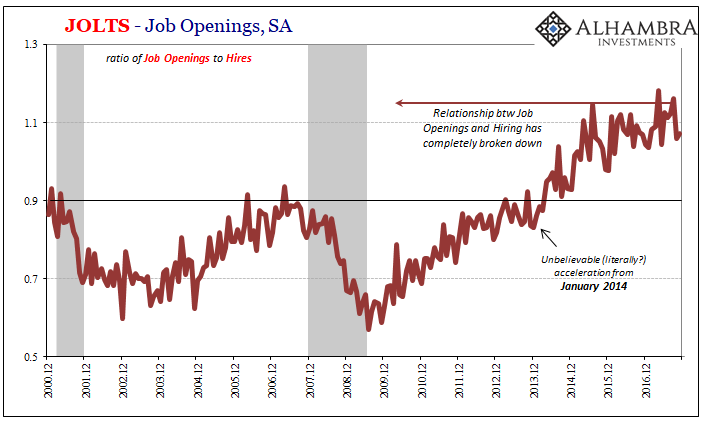
The latest JOLTS survey from the BLS suggests nothing much has changed from that particular view of the labor market. The level of estimated Job Openings (JO) while down slightly over the last few months remains exceedingly high. By contrast, the rate of monthly Hires (HI) continues to be subdued, if at the high end of its recent range extending back to the middle of 2015.
That really means the JOLTS data presents not one but two very distinct pictures of the employment environment. This is a relatively new divergence, one that opened up at the start of 2014 when JO spiked. The prior relationship that had existed going back to the origins of the series was obliterated, and though HI has come up somewhat over those almost four years in between there is still, again, wide disagreement.

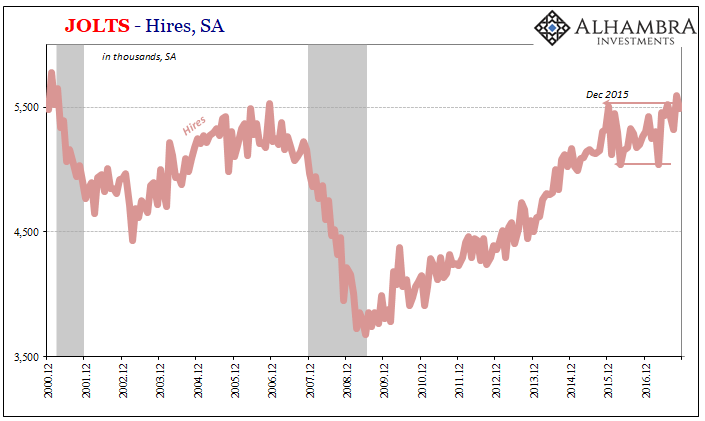
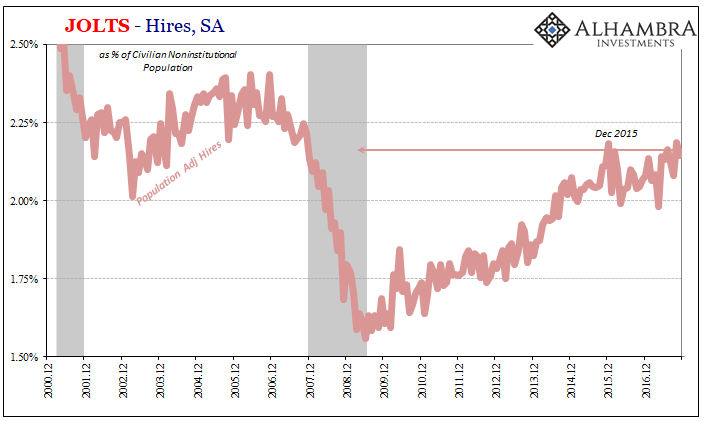
The difference is all the more glaring when we adjust for population growth. After all, the 5.5mm hires estimated for November 2017 aren’t the same as the 5.5mm figured in November 2006.
The reason we pay any attention to JOLTS at all is the longstanding desire to gain a more complete picture of what’s really going on in the economy as it relates to demand for labor. The unemployment rate and even the Establishment Survey are geared more toward supply factors, particularly the former.
It’s this one-sided orientation that drove economists more than a half century ago to explore alternate means of measurement. I wrote about the resulting Beveridge Curve, and the implications for it within the framework of JOLTS, back in September of 2015:
In the 1940’s, William Henry Beveridge devised a method to try to estimate any such structural economic changes by comparing the unemployment rate to some measure of generic job openings (Help Wanted ads in those days). The Beveridge Curve asserts that very relationship, meaning that there should be an inverse relationship between unemployment and Help Wanted. Plotted, this association and correlation should follow a downward sloping line where the X-axis is the unemployment rate and the Y-axis some version of business demand for labor.
It’s one of those very simple ideas that at the time was pretty genius. The Beveridge Curve is supposed to be downward sloping given the intuitively inverse relationship between unemployment and labor demand. It was in figuring out how to measure the latter that left Dr. Beveridge a place in Economics history.


