Something is Clearly Amiss in Manufacturing
As we have pointed out on occasion of last week’s economic data update, we tend to focus on the manufacturing sector for a number of reasons. These are: 1. the manufacturing sector is in fact the largest sector of the economy in terms of gross output; 2. given that the various stages of production of the sector are temporally removed from the consumption stage, it is susceptible to attracting a lot of malinvestment during boom periods (often as a boom progresses, malinvestment will later also flow to the consumer stages as overconsumption surges, but this has only been selectively the case in the current cycle); 3. wealth is generated by savings, investment and production (all of which appear to be in trouble).
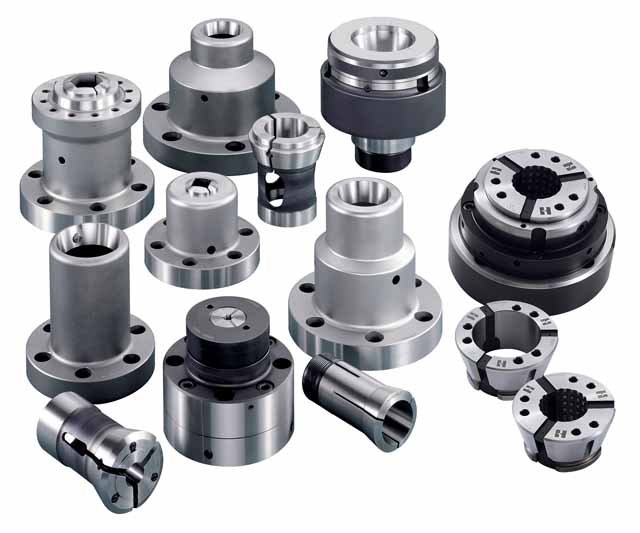
Assorted machine tools (adaptors) – typical early to intermediate stage products for use in other production processes
Our friend Michael Pollaro has mailed us two more charts pointing to growing weakness in the sector which we are reproducing below. Meanwhile, another hat tip is due to our friend BC, who has pointed out a recent development to us we were actually unaware of and that we show below as well. As you will see, we can actually observe a few oddities in the current cycle, which were not in evidence in previous cycles.
The first chart depicts the change in national ISM new manufacturing orders compared to the percentage change of the dollar value of core new factory orders according to US census data lagged by 6 months (for all manufacturing and manufacturing ex aircraft). As Michael remarked to us, the ISM data may be skewed by survivor bias in the current cycle.
As can be seen, normally the 6 months lagged change in the dollar value of core factory orders is aligned quite well with the ISM new order index (meaning, the latter is usually leading by about 4 to 6 months), but not this time. Instead, the two series have drifted apart quite a bit. We would argue that apart from survivor bias, there may also be a flaw in the seasonal adjustments to ISM data due to the large swings of the 2007-2009 recession (this is just a hunch).
Click on image to enlarge
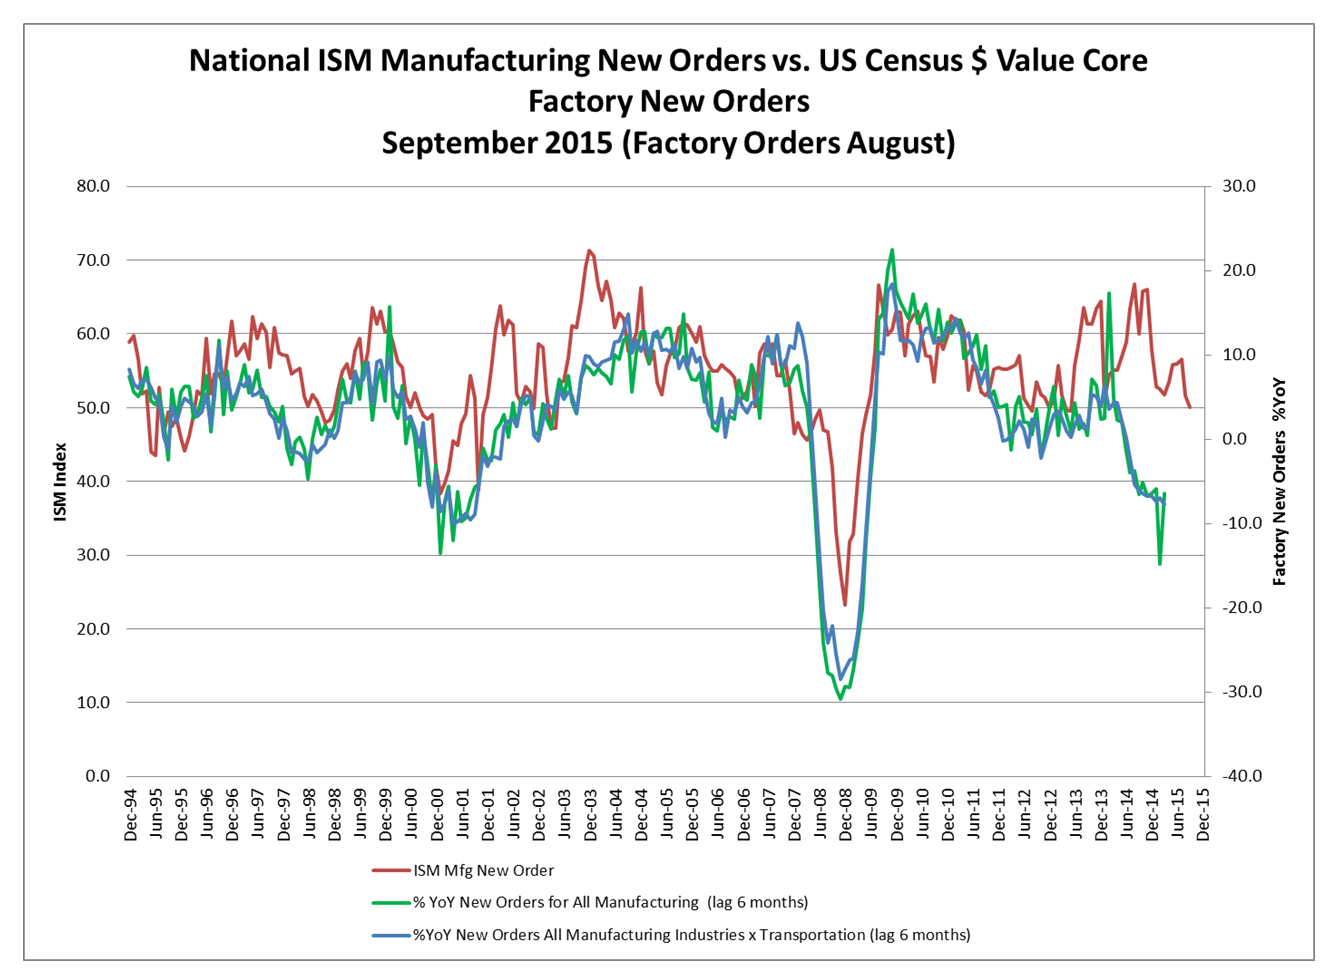
ISM new orders index vs. change in $ value of core new factory orders incl. and excl. aircraft (census data) lagged by 6 months
Of course, the actual dollar value is what these new orders are worth to manufacturers in money terms. The recent plunge has already reached levels last seen during the 2000-2002 recession.
We would guess that there are two main drivers of this development: firstly, the massive slowdown in international trade due to economic weakness overseas combined with a stronger dollar has cut into export orders, and secondly, the plunge in oil prices has put a halt to capex in almost the entire fracking space; the same goes for other commodity producing operations, which are suffering due to the general decline in commodity prices. Given that (largely debt-financed) capex by the energy sector was a major factor in the recovery, we are now witnessing the effect of its ongoing demise.


