Gold Prices Eye Fresh 2017 Highs Following Lackluster U.S. NFP Report
Fundamental Forecast for Gold: Bullish
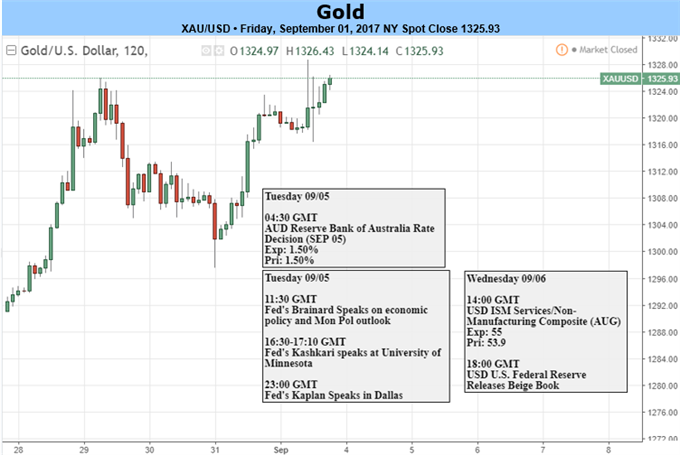
Gold prices remain bid going into the first full week of September, with bullion at risk of marking fresh 2017 highs as market participants appear to be diversifying away from the U.S. dollar.
The reaction to the lackluster U.S. Non-Farm Payrolls (NFP) report suggests gold will continue to exhibit a bullish behavior ahead of the Federal Open Market Committee (FOMC) interest rate decision on September 20 as mixed data prints coming out of the economy sap bets for another rate-hike in 2017. Even though ‘the Committee expects to begin implementing its balance sheet normalization program relatively soon, the fresh forecasts from Chair Janet Yellen and Co. may ultimately heighten the appeal of gold if central bank officials attempt to buy more time and project a more shallow path for the Fed Funds rate.
In turn, U.S. Treasury Yields may stay depressed throughout the remainder of the year, and the precious metal may continue to retrace the decline from 2016 amid the shift in trader behavior.
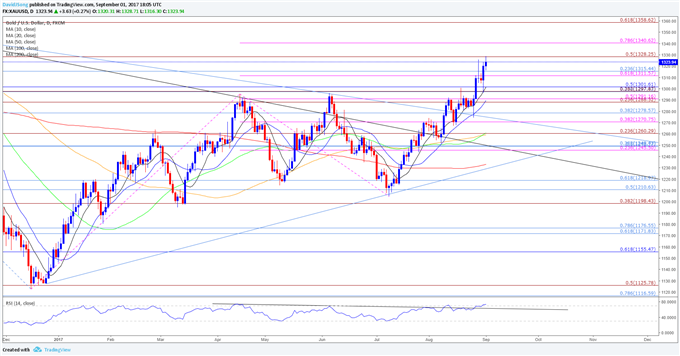
XAU/USD Daily Chart
Download the DailyFX 3Q Forecasts
Topside targets remain on the radar for gold as it breaks out of the downward trend carried over from the previous year, with the Relative Strength Index (RSI) highlighting a similar dynamic. The bullish momentum looks to be gathering pace as the oscillator breaks above 70 and pushes deeper into overbought territory, with a close above the $1328 (50% expansion) hurdle opening up the next region of interest around $1340 (78.6% expansion), which sits just above the November-high ($1337). Keeping a close eye on the former-resistance zone around $1297 (23.6% retracement) to $1302 (50% retracement) as it appears to be offering support.
Retail Sentiment
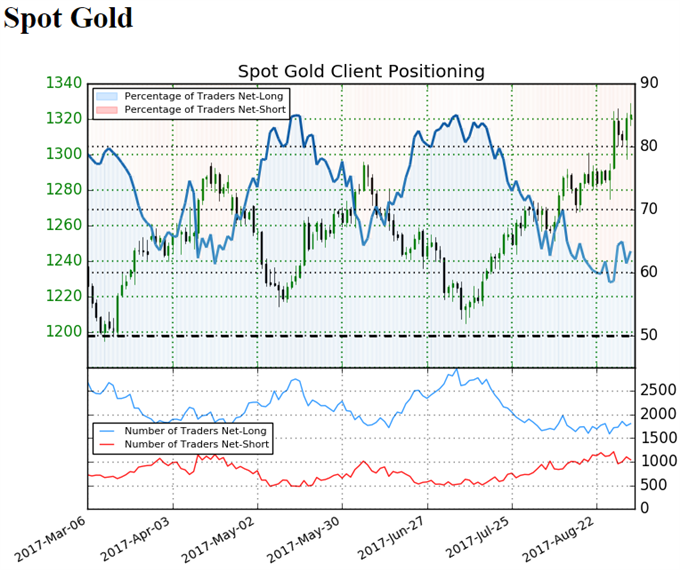
Retail trader data shows 63.4% of traders are net-long with the ratio of traders long to short at 1.73 to 1. The number of traders net-long is 2.7% lower than yesterday and 2.8% lower from last week, while the number of traders net-short is 3.0% higher than yesterday and 6.9% lower from last week.


