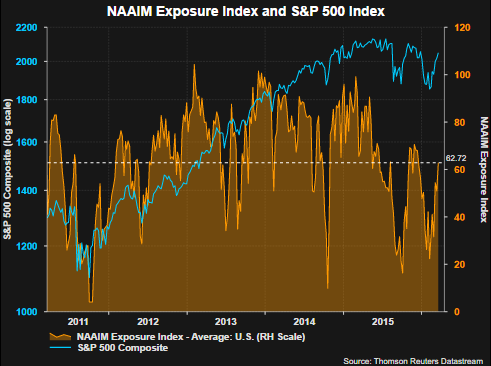
Near the end of February we noted pessimism was being exhibited by both individual and institutional investors. In addition to this pessimistic view of the market, we noted some economic data was looking more favorable and combined, higher equity prices could result in the weeks ahead. True to form investors took advantage of the market pullback and added to their equity positions and the market has moved higher for five straight weeks. At the time of that post, the NAAIM Exposure Index was reported at 31.65. This past week’s exposure index reading came in at 62.72 and notes NAAIM member firms have increased long equity exposure.
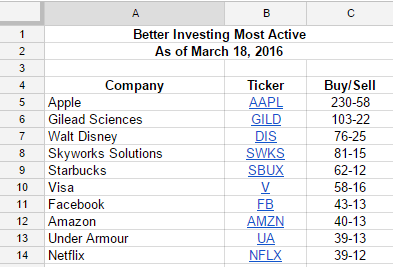
Interestingly, individuals continue to indicate a low level of bullish investor sentiment as reported by the American Association of Individual Investors. This is a contrarian indicator and leads one to believe individuals are skeptical about the market’s recent advance. On the other hand, Better Investing Magazine tracks the voluntary reporting of most active stock transactions of its members. The below list shows the current ten most active stocks. New additions to the list since my last report on this at the end of December are Facebook (FB), Amazon (AMZN) and Netflix (NFLX).
Full View
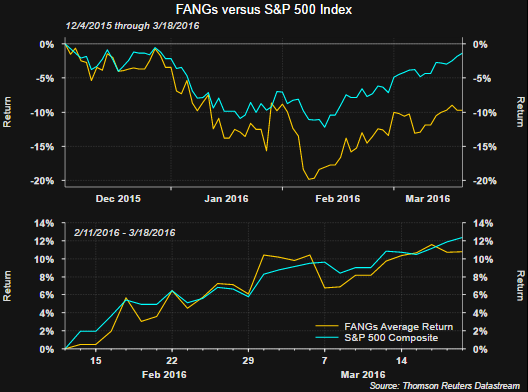
These three stocks are apart of the frequently cited basket of FANG stocks. The FANG’s strong returns in 2015 were a key reason the S&P 500 Index was able to generate a small positive return last year. If there is anything these three stocks have in common today though it is the fact they trade at high multiples of price to earnings. Certainly investors may find the stocks attractive given their pullback since peaking in December last year; however, the fact Better Investing members find these attractive is a ‘risk on’ mind set in my view.
And a look at one last sentiment variable, the 21 day moving average of the equity put/call ratio. At the end of January, the average of the put/call ratio peaked at .79 after reaching .60 in June last year. A downward trend in the 21-day M.A. is generally associated with higher equity prices and after its January peak this has been the case.


