– Gold hedges massive ongoing devaluation of U.S. Dollar
– 46th anniversary of ‘Tricky Dicky’ ending Gold Standard (see video)
– Savings destroyed by currency creation and now negative interest rates
– Long-term inflation figures show gold a hedge against rising cost of fuel, food and cost of living
– $20 food and beverages basket of 1971 cost $120.17 in 2017
– Household items increased by average of 2000% and oil by 5,373% since 1913
– Gold gained 5,669% since 1913; by nearly 3,000% since 1971
– Dollar has been reserve currency of world in the period and most other currencies have seen greater devaluation
– Evidence of gold’s role as inflation and currency devaluation hedge
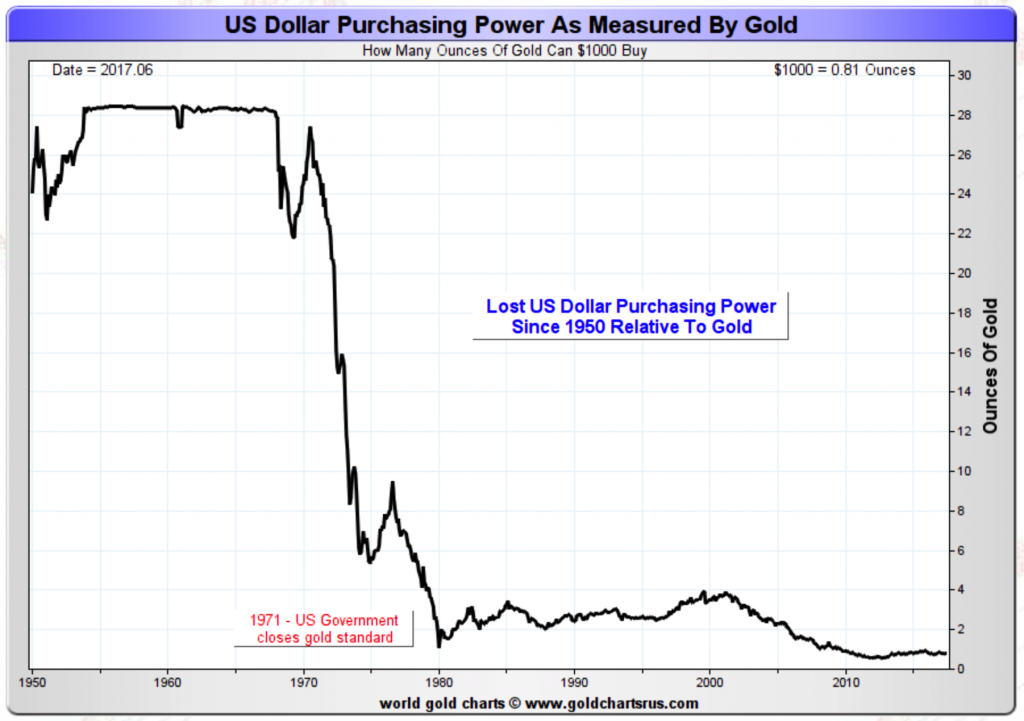
‘US dollar Purchasing Power As measured By Gold’
Source: Goldchartsrus
You don’t need ‘Tricky Trump’ to devalue the dollar, it’s been doing that since 1913 and ‘Tricky Dicky’ in 1971
In 2015 President Donald Trump made headlines when he told a town hall event in Atkinson, New Hampshire about how his father had once given him a ‘small loan of a million dollars.’
Outcry swept around the media who asked how much the future President was really in touch with the common voter.
Whilst Trump’s reference to ‘small’ was in relation to the (apparent) size of the empire he subsequently built he may as well have been referring to the value of a million dollars now and how small it is compared to in 1975 when he was lent the money.
$1 million dollars was a lot of currency in 1975. Today it will barely buy you a nice house in a nice city.
Using today’s CPI data Trump Sr’s $1 million loan would today be equivalent to $4.4 million. The purchasing power of a 1975 US dollar has fallen by over 400%. It has fallen a lot more since 1971.
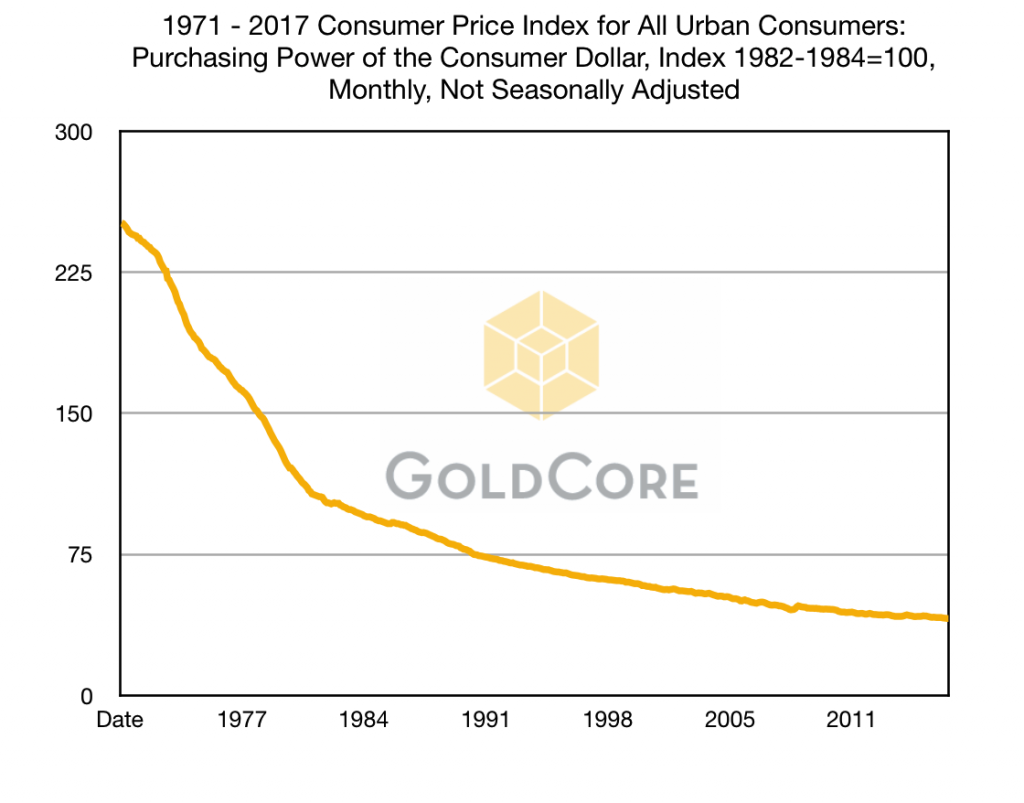
In this week 46 years ago on August 15, 1971, President Nixon announced the U.S. Dollar would completely cut ties with sound money gold (see video below).
Without gold backing and gold as a monetary anchor, we can now see just how much the purchasing power of the consumer dollar has declined since 1971.
You can see an even better example of the dollar’s collapse in purchasing power when measured in gold ounces (see charts above).
Prices climb by over 2000% since 1913 and creation of the Fed
‘[Since 1913] the general public and policymakers have focused almost constantly on inflation; they have feared it, bemoaned it, sought it, and even tried to whip it.’ Bureau of Labour Statistics.
In 1970, after many decades of dollar devaluation, Herbert W. Armstrong quoted the Labor Department’s figures for how much $5 would have purchased in 1913:
“15 pounds of potatoes, 10 pounds of flour, 5 pounds of sugar, 5 pounds of chuck roast, 3 pounds of round steak, 3 pounds of rice, 2 pounds each of cheese and bacon, and a pound each of butter and coffee; that money would also get you two loaves of bread, 4 quarts of milk and a dozen eggs. This would leave you with 2 cents for candy.”


