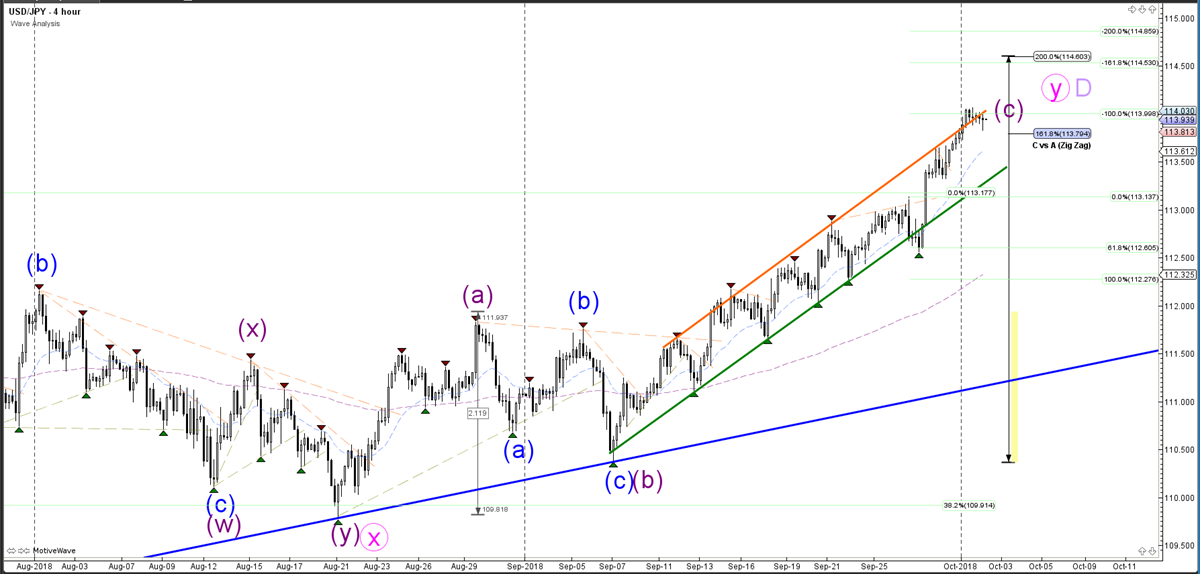
USD/JPY
4 hour
(Click on image to enlarge)
Source: Admiral Markets MT5 with MT5 USD/JPY motive wave – Accessed 2 October 2018 at 5:00 AM GMT
The USDJPY currency pair is making a small consolidation zone at the -100% Fibonacci target near 114, which is a new decision zone for a bullish breakout or a bearish bounce. The candlestick patterns will confirm the immediate direction, but ultimately, the trend remains bullish and the price could complete wave C (purple) of wave Y of D at higher Fib targets.
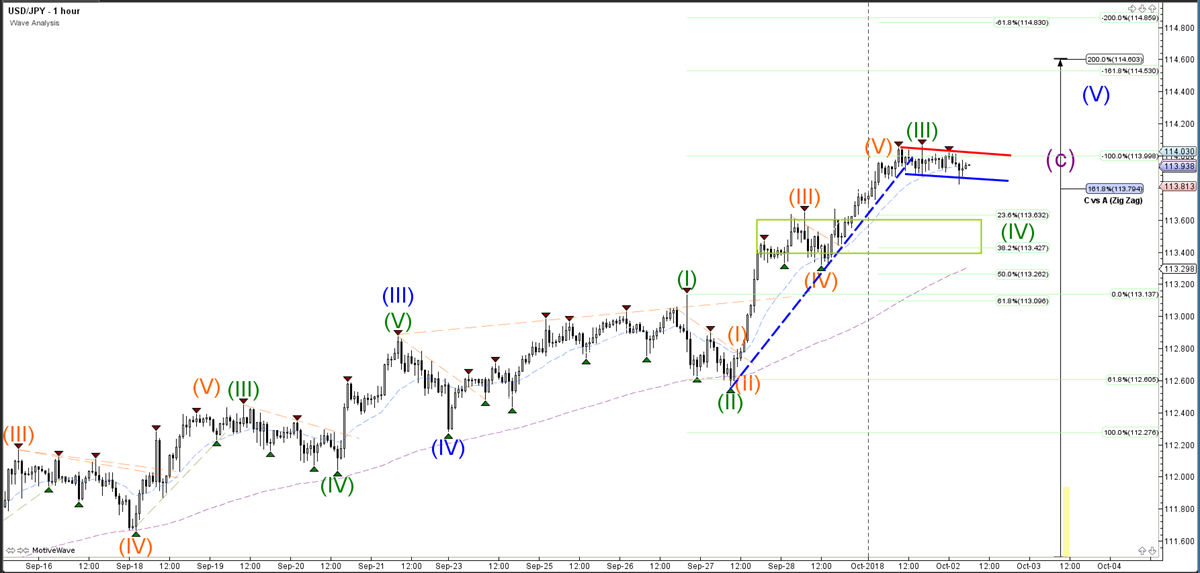
1 hour
(Click on image to enlarge)
Source: Admiral Markets MT5 with MT5 USD/JPY motive wave – Accessed 2 October 2018 at 5:00 AM GMT
The USDJPY currency pair seems to have completed a wave 3 (green) due to the current consolidation zone or the bull flag chart pattern. A break below the support trend line (blue) could indicate a pullback to the Fibonacci retracement levels, whereas a bullish break above the resistance (red) might see the price move higher.
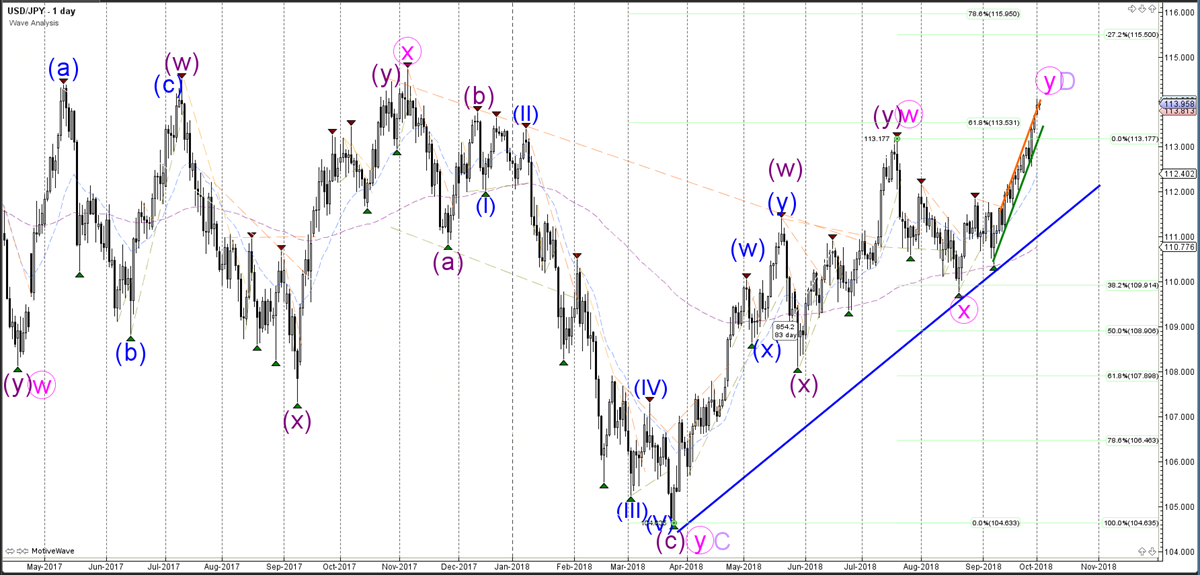
Daily
(Click on image to enlarge)
Source: Admiral Markets MT5 with MT5 USD/JPY motive wave – Accessed 2 October 2018 at 5:00 AM GMT
The USDJPY currency pair is showing a new higher high, but the bullish trend channel could still be part of a larger triangle (wave D purple), as long as the price remains below the 78.6% Fibonacci level at 115.95.


