The recent market volatility has led to a lot of head scratching. Even the Pundit-in-Chief seems to be struggling to make his daily morning and evening observations fit with observed reality. With a light economic calendar and earnings reports just getting started market observers will be asking:
What’s the cause of the market volatility?
Prior Theme Recap
In my last WTWA I predicted that everyone would be wondering whether global weakness would drag down the U.S. economy. This proved to be one of my better guesses. Monday’s trading opened with concern about “record low industrial profits” in China and ended with the weaker-than-expected employment report on Friday. Nary had an hour passed during the week without someone chiming in on the global weakness theme. To get the wild weekly story, let us look at Doug Short’s weekly chart. This one saves more than a thousand words! (With the ever-increasing effects from foreign markets, you should also add Doug’s World Markets Weekend Update to your reading list).
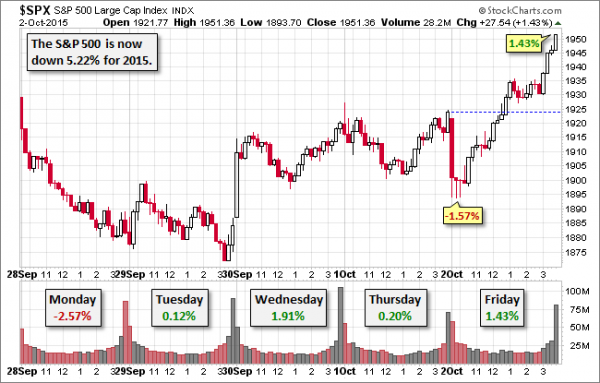
Doug notes that the intra-day swing is in the top 3% of moves during this year. See his World Markets Weekend Update for more excellent charts and analysis.
We would all like to know the direction of the market in advance. Good luck with that! Second best is planning what to look for and how to react. That is the purpose of considering possible themes for the week ahead. You can make your own predictions in the comments.
This Week’s Theme
Along with the increase in volatility there is a bull market in theories. Market observers like to think they can explain every move. It makes them seem smart on TV and also provides some comfort when trades go the wrong way. This week’s trading was especially interesting since big moves happened without a proximate news event to label as the cause.
With earnings reports just getting started and a light economic calendar, there is time for some pondering of the past. I was going to use, “What’s it all about?” with appropriate theme music, but I can be a little more specific. I expect the pundits to be asking:
What is behind the increase in market volatility?
As always, the viewpoints are varied.
The Viewpoints
Almost everyone has some theory about volatility including the following:
- Seasonality – it is just that time of year.
- Good news is now good news, and bad news is bad. This notion lasted for about two hours after the jobs report!
- Reaction to all data related to China, which always seems to signal weakness.
- Someone from the Fed said something.
- International conflicts and related effects on oil prices.
- Oil price movements. But why are higher prices viewed as a market positive?
- Thin markets are easily moved. Wait until earnings season.
As always, I have my own ideas in today’s conclusion. But first, let us do our regular update of the last week’s news and data. Readers, especially those new to this series, will benefit from reading the background information.
Last Week’s Data
Each week I break down events into good and bad. Often there is “ugly” and on rare occasion something really good. My working definition of “good” has two components:
The Good
There was some good economic news – some of which is challenging to interpret.
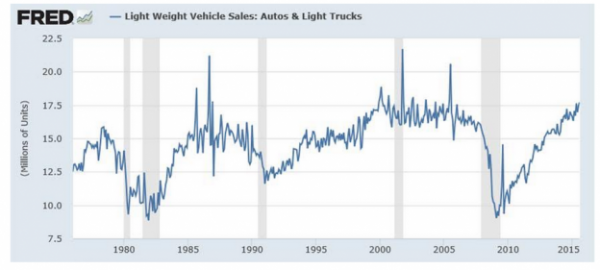
Auto sales were excellent. This is an important spending indicator using non-government data. We should take it seriously. “Davidson” (via Todd Sullivan” writes as follows:
The history of vehicle sales shows that current rate is very high and still trending higher. The historical record reveals that at some point the sales trend eventually levels off and continues at high levels for 3yrs-4yrs prior to the next recession. We have yet to reach a sustained sales level. Sales are still rising!
The Bad
There was also negative news, with similar mixed themes if you look a little below the surface.


