The market is downright bullish. There is little reason to argue the point given the bullish trends of markets globally which are strongly trending, positively correlated, and simultaneously breaking out to all-time highs. Of course, such is not surprising given the massive levels of Central Bank interventions, suppressed interest rates, and global coordination between Government’s and major asset managers (banks) over the last eight years.
Importantly, as bullishness has reached historically high levels, the fear of a market crash, or another crisis, has faded into the abyss. As Mark DeCambre noted:
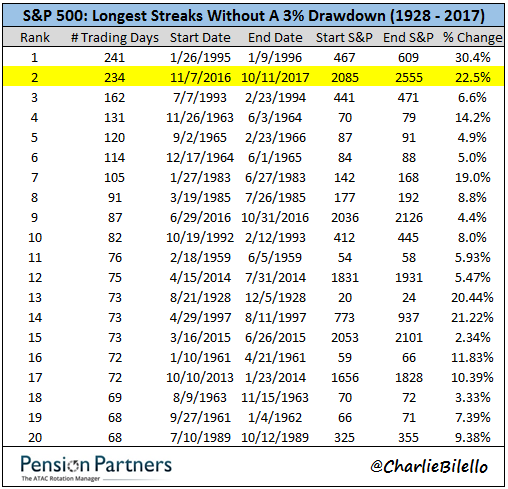
“By at least one measure, the S&P 500 index is on pace to register its lengthiest period of quiescence in more than two decades—and perhaps ever.
The broad-market benchmark hasn’t experienced a decline of at least 3% since Nov. 7, 2016. That 236-day span registers as the second-longest period without a single-session drop of that magnitude since the 241 days from Jan. 26, 1995 to Jan. 9, 1996, according to Pension Partners’ Charles Bilello (see table below):“
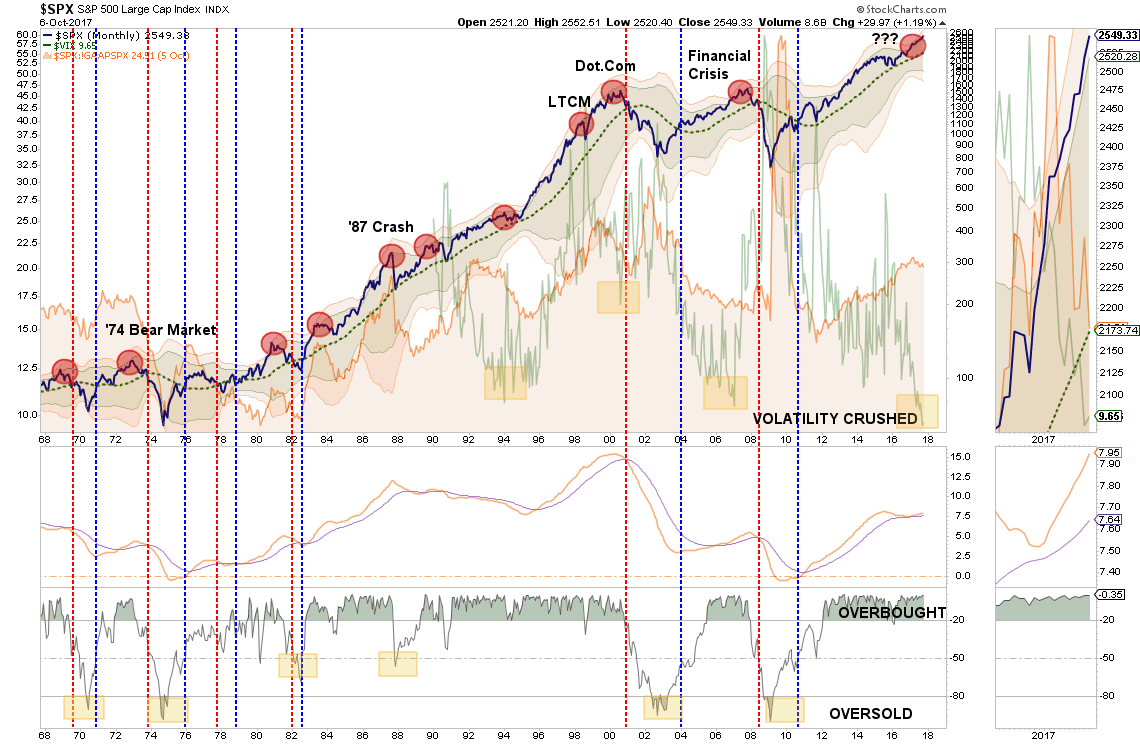
This lack of volatility, flood of liquidity from Central Banks, and a seemingly “bullet-proof” rise in the market has boosted investor confidence to exuberant levels. That consistent push higher, without a correctionary process along the way, has pushed the market into “extremely overbought, extended, and bullish territory.” As shown visually in last weekend’s newsletter:
When I discuss this, I am often asked exactly what is meant by such a statement. This week, I am going provide a basic course in technical analysis as the “overbought, bullish and extended” theme is likely to remain intact for several months to come.
Clarifying Over Bought, Extended & Bullish
What exactly is meant by the markets being overbought, overextended and overly bullish? These are concepts, which once understood, will hopefully lead you to managing your money more successfully over the long term.
What Do You Mean By Overbought?
I am often asked that since there is “always a buyer for every seller,” then how can a market become overbought?
Before we get into the raw technical analysis of showing the “overbought” condition let’s rationalize what one is and how it occurs.
First, while it is true that there is always a buyer and seller in every transaction it is the “supply and demand” of those buyers and sellers at a particular price point that affects the overall price. Let me explain.
Imagine two rooms of 100 individuals each that want to buy shares of ABC stock. Room A has 100 individuals that currently own ABC stock and Room B has 100 individuals with cash wanting to buy shares of ABC. The table below shows a very simplified model of this process.
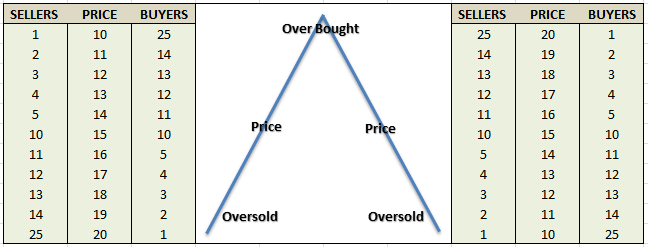
At $10 a share, there are numerous buyers but sellers are few. The demand for the shares drives the price higher which entices more sellers. As long as the demand for shares outpaces the supply of sellers – the price is pushed higher. However, at some point, the price reaches a level that exhausts the supply of buyers. The next price decline occurs as sellers have to begin lowering prices to find buyers.


