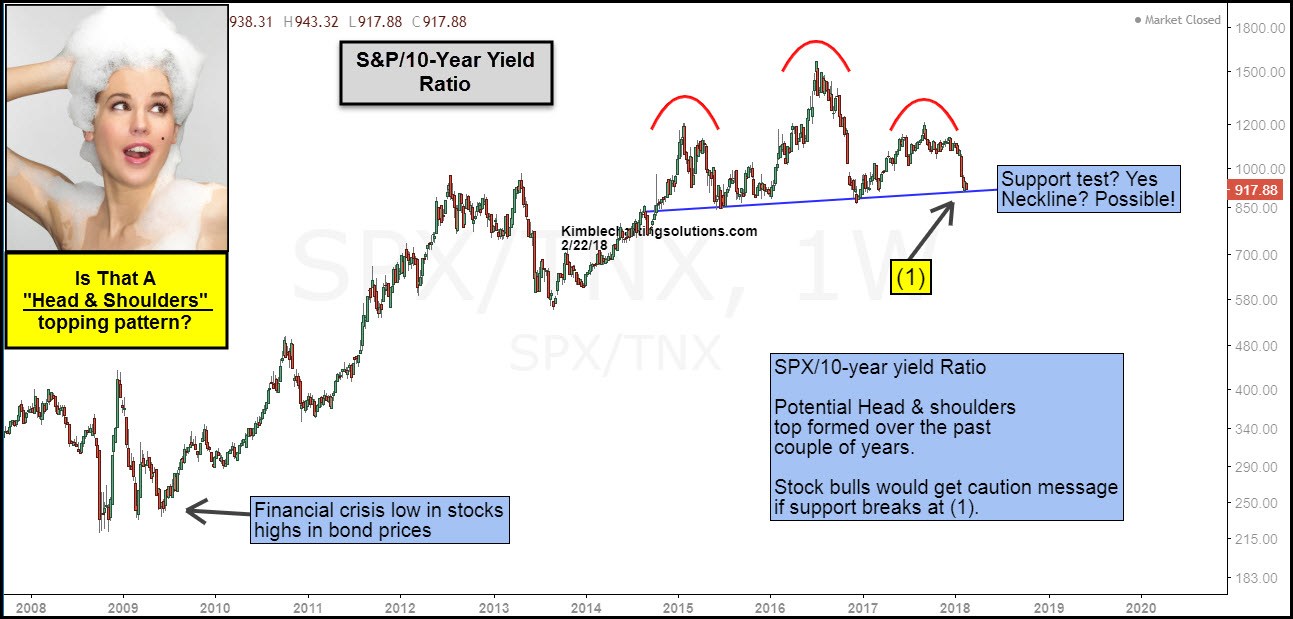
The above chart takes a look at the S&P 500/10-year Yield (TNX) ratio over the past 10-years. At the time of the financial crisis lows, the ratio itself was very low and created a series of higher lows in 2009, before embarking on a quality rally for years.
Over the past few years, the ratio has, for the most part, traded sideways. While trading sideways it could be forming a multi-year “head & shoulders” topping pattern.
Even if the head & shoulders pattern is NOT a correct read, the key to this pattern in my humble opinion is that a 3-year test of support is in play at (1). At this time let’s be clear about this…Support is Support until broken.
If 3-year support would give way, it would send caution message to stocks.
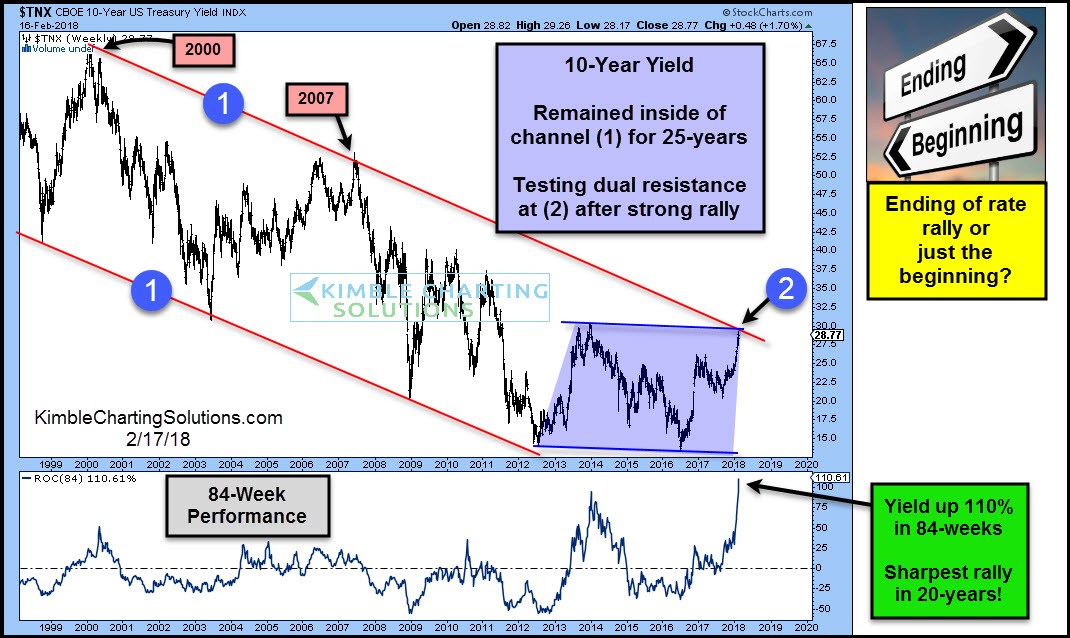
Below looks at yields are testing 25-year falling resistance after being up 110% in the past 84-weeks, which was the sharpest rally in 20-years! What yields do at the top of the 25-year falling channel will have an impact on the stock/bond yield ratio!
I am of the opinion that several “Multi-Decade Opportunities” are facing each of us at this point in time.


