(Click on image to enlarge)
On a global scale, the U.S. economy is massive at close to $19 trillion in size.
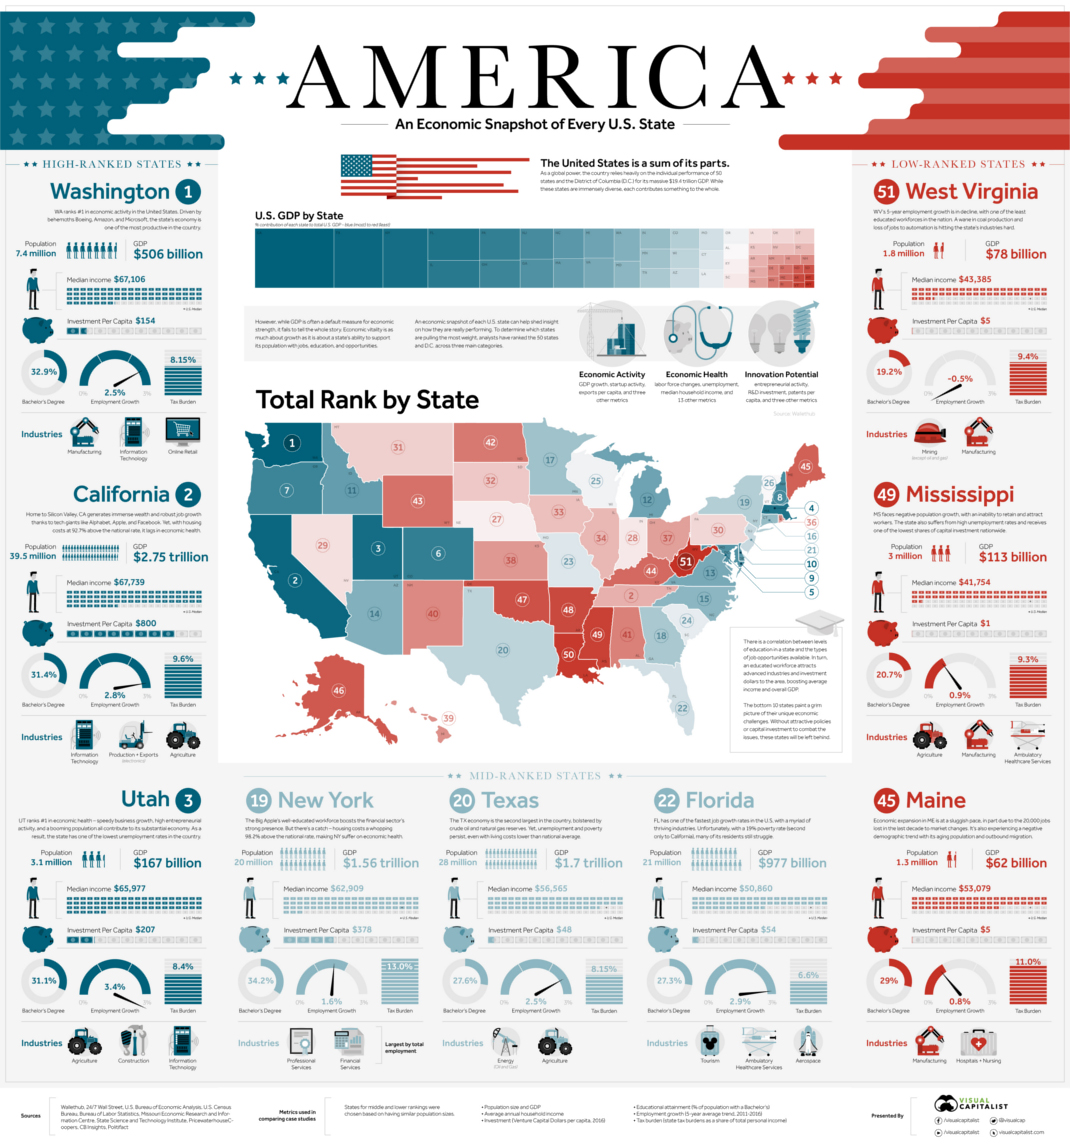
However, the United States is also the sum of its parts. America represents the union of 50 states and other jurisdictions such as D.C., and all of these state-level economies have their own unique problems to overcome, drivers of growth, and local resources that factor into their prosperity.
How can we compare these state economies on an even playing field?
RANKED: STATE ECONOMIES
Using absolute numbers, it’s hard to directly compare California ($2.75 trillion GDP, 39.5 million people) to a state like Vermont ($33 billion, 0.6 million people). By leveling the playing field, we can get an idea of how states contrast in terms of relative economic strength that companies and workers would better recognize.
Today’s infographic uses 27 metrics from WalletHub to rank state economies. These metrics are grouped into three major categories, which are evenly weighted:
1. Economic Activity: GDP growth, startup activity, exports per capita, and three other metrics
2. Economic Health: Labor force changes, median household income, unemployment, and 13 other metrics
3. Innovation Potential: Entrepreneurial activity, R&D investment, patents per capita, and three other metrics
Note: the full methodology with all 27 factors can be found here.
Here’s how the rankings shake down, for all 50 state economies and D.C.:


