A daily rally in gold, daily decline, daily turnaround and other daily price developments are both interesting and dangerous. Interesting, because nothing is as exciting as a big intraday move. Dangerous, because they can make one too emotional about a given trading position and lose the focus on the big picture (forgetting about the forest by focusing on individual trees). In today’s analysis, we feature two analogies to the previous situations in gold which should make it clearer what’s likely to be seen in the coming months, even if a lot of daily price swings in both directions are about to be seen shortly.
The first analogy is the link between the 2011 top and the follow-up action, and the 2016 top and the follow-up action.
Let’s take a look at the chart for details (chart courtesy of http://stockcharts.com).
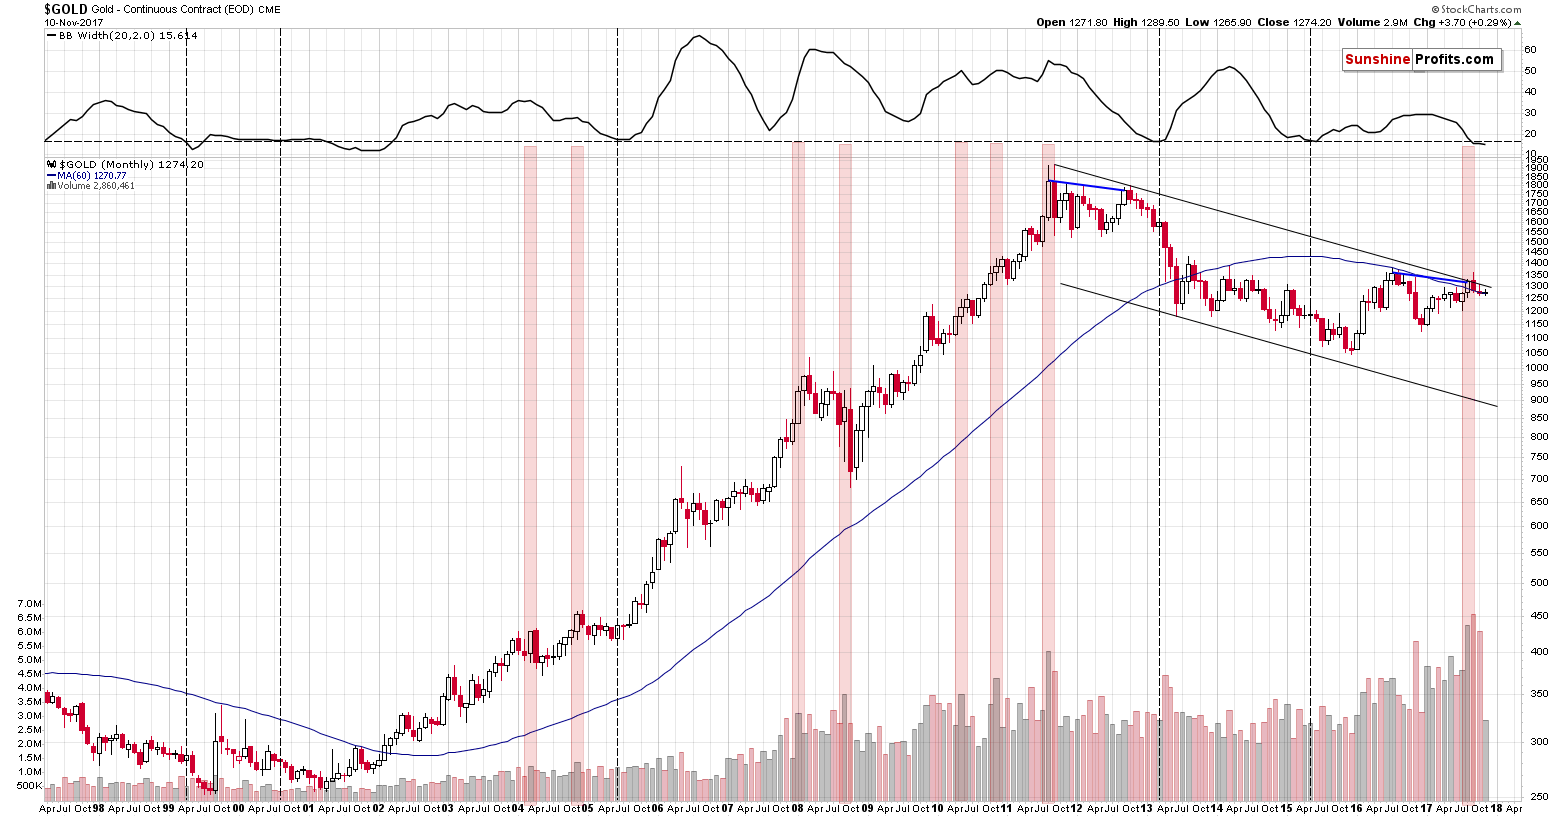
There are two important signals that we would like to discuss: the size of the monthly volume levels and the decline in monthly volatility as measured by the Bollinger Band’s width (indicator in the upper part of the chart). There’s also one additional analogy that we’ll discuss later on. Let’s start with the former.
The volume on which gold rallied in August was huge and it’s directly comparable to only one case from the past – the 2011 top (especially given huge volume that we saw in the next month when gold declined). That’s the only case when gold’s monthly upswing was accompanied by volume that was similarly big. Since that was THE top, the implications here are naturally bearish. Gold has already declined since that time, but since the follow-up action in 2011 and subsequent years were much more bearish, we should prepare ourselves for bigger declines in the coming months.
However, there are more analogies that are also important. Considering other monthly volume readings, when gold moved higher on volume that was visibly bigger than the previous values, we get the same implication. We marked similar cases with red rectangles. Two 2004 declines, the final part of the 2008 decline and – approximately – the 2008 top, the two 2010 corrective downswings, and finally the 2011 top were all accompanied by or preceded by huge monthly volume readings. In three cases (the 2008 top and both 2010 corrections) the signal was not precise as the decline started in two months, not in the next month, but still, the efficiency of this signal in a strong bull market where gold rallied in the vast majority of months is still remarkable.


