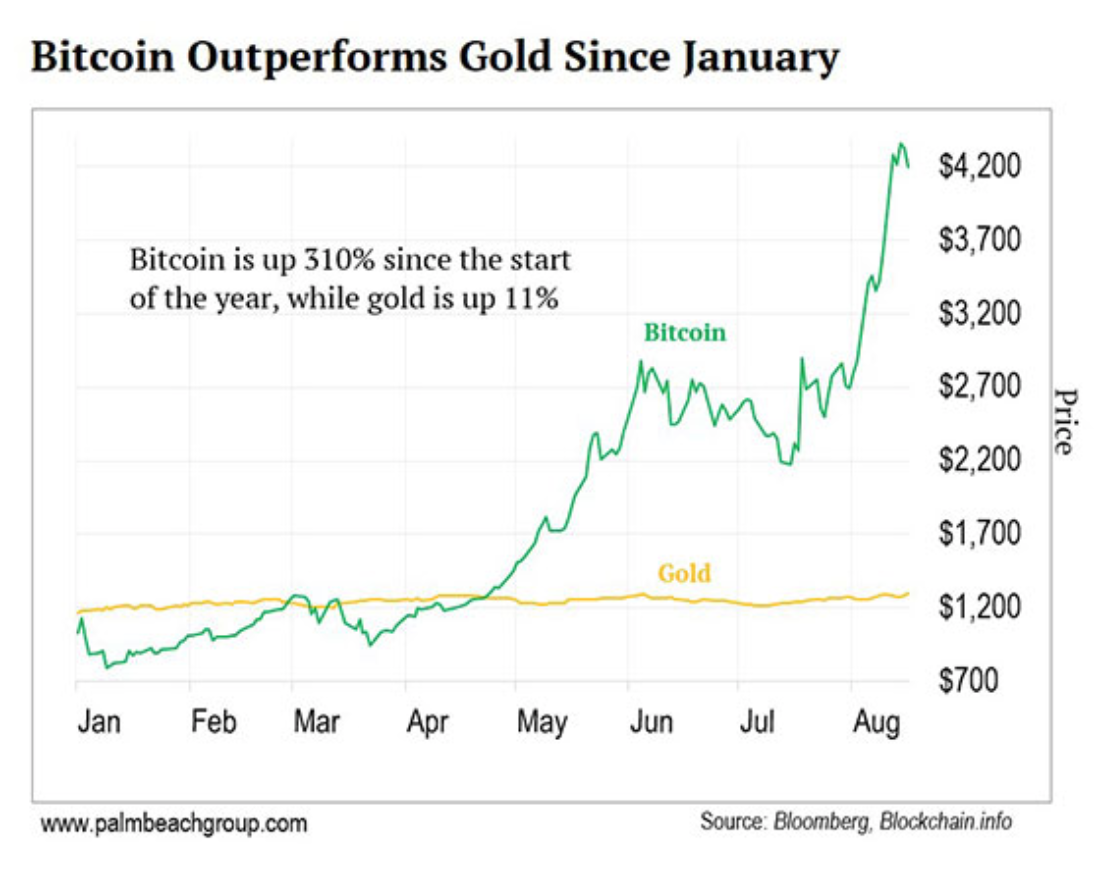
I don’t want to start a religious war here but clearly, in 2017, BitCoin has vastly outperformed Gold as my first chart shows. I am still very positive that Gold and the PM sector will have its time in the sun again, but GBTC has given me another asset to trade while Gold and PMs have largely consolidated sideways for most of the year.
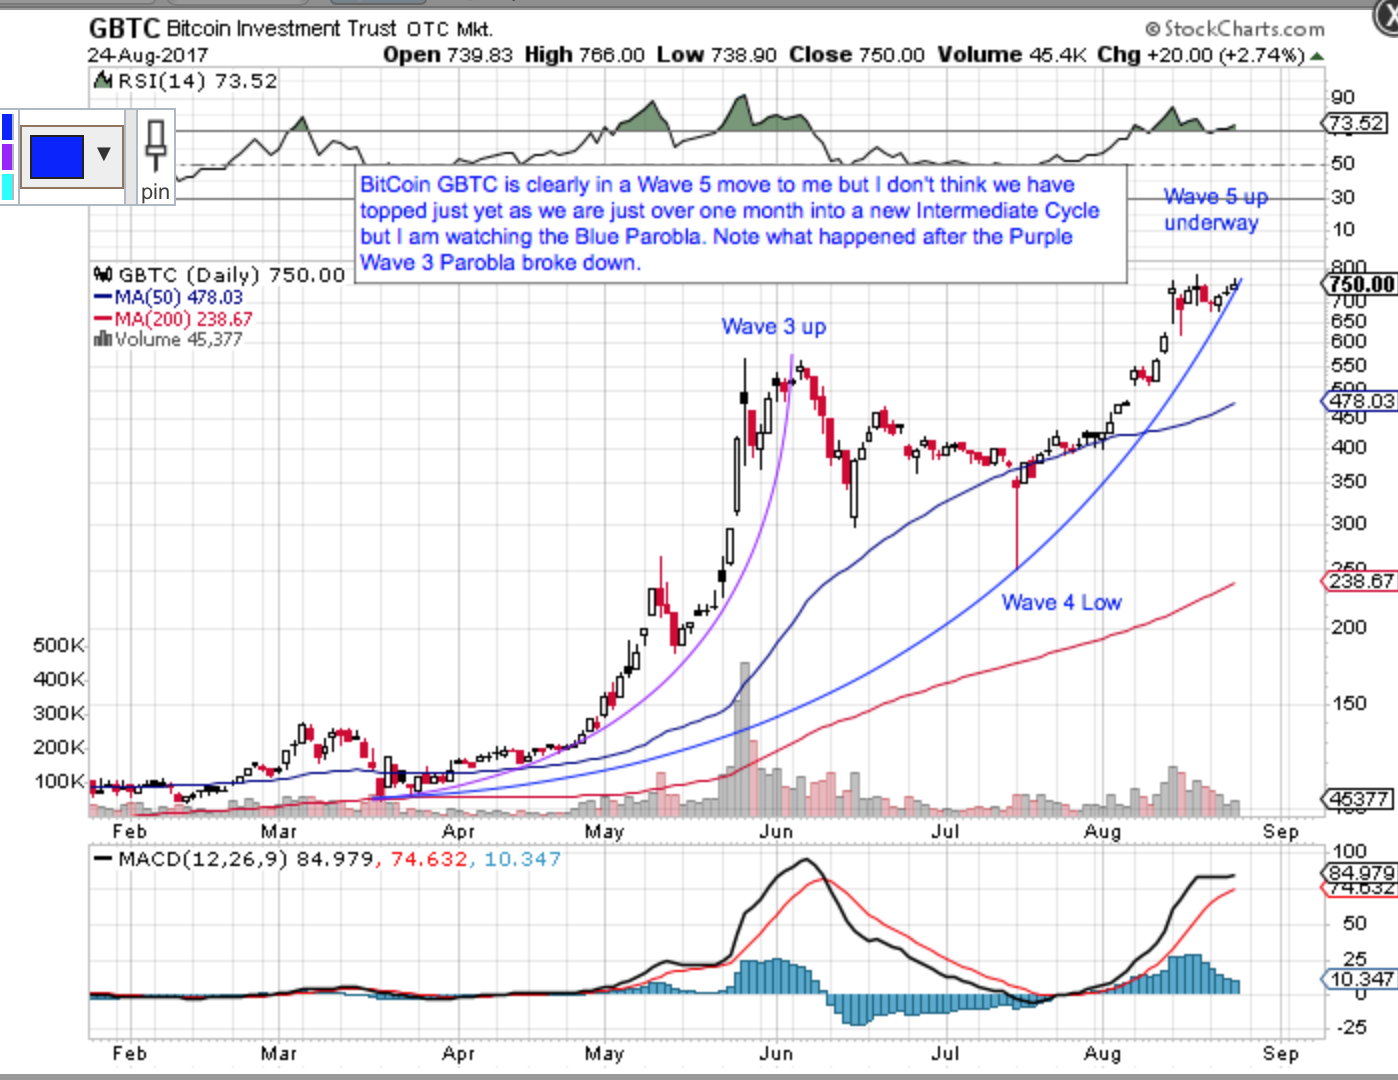
That said, the move in BitCoin appears to me to be in Wave 5 of an Elliott Wave pattern which will lead to a major top. Once it tops, according to Mr. Elliott, we will very likely see an ABC correction which will move price much lower than most expect. That is what is needed to re-set investor sentiment to bearish so the next leg up can begin. My second chart on GBTC shows the Wave 3 and 5 Parabola’s on the chart. These never end well but I will be doing my best to squeeze as much out of this Wave 5 move as I can.
Added: BTW, BitCoin is surging overnight and is closing in on its ATH this evening.
Now to Gold. My first chart is a 2 year Weekly that shows how Gold has spent much of 2017 consolidating. Note how tight the Bollinger Bands are on this weekly chart signaling that a Big Move is likely coming. Often times, the first move out of these narrow Bollinger bands is the false one. Not a “cut and dried” rule but something I have noticed. The chart also shows Gold’s breakout above the downtrend from July 2016 which I think is a significantly longer term.
Significant enough to not be shorting anything in the PM sector as my Cycle analysis on Gold’s next direction may well be wrong. The cycle count is getting long here, Gold is coiling so a short setup is not yet visible on the charts yet. The smarter play here is to save your ammo for a long position hopefully sometime over the next few weeks.
My second chart shows the close-up action and how Gold is crawling along the 10ema right now. This is actually bullish longer term as if Gold is headed lower in the short term, the more time it spends moving sideways, the less time it spends moving lower. My last chart is an 8 year Weekly showing that Gold is wedging to a decision point between it’s 2011 downtrend and its late 2015 uptrend.


