GBP/USD
4 hour
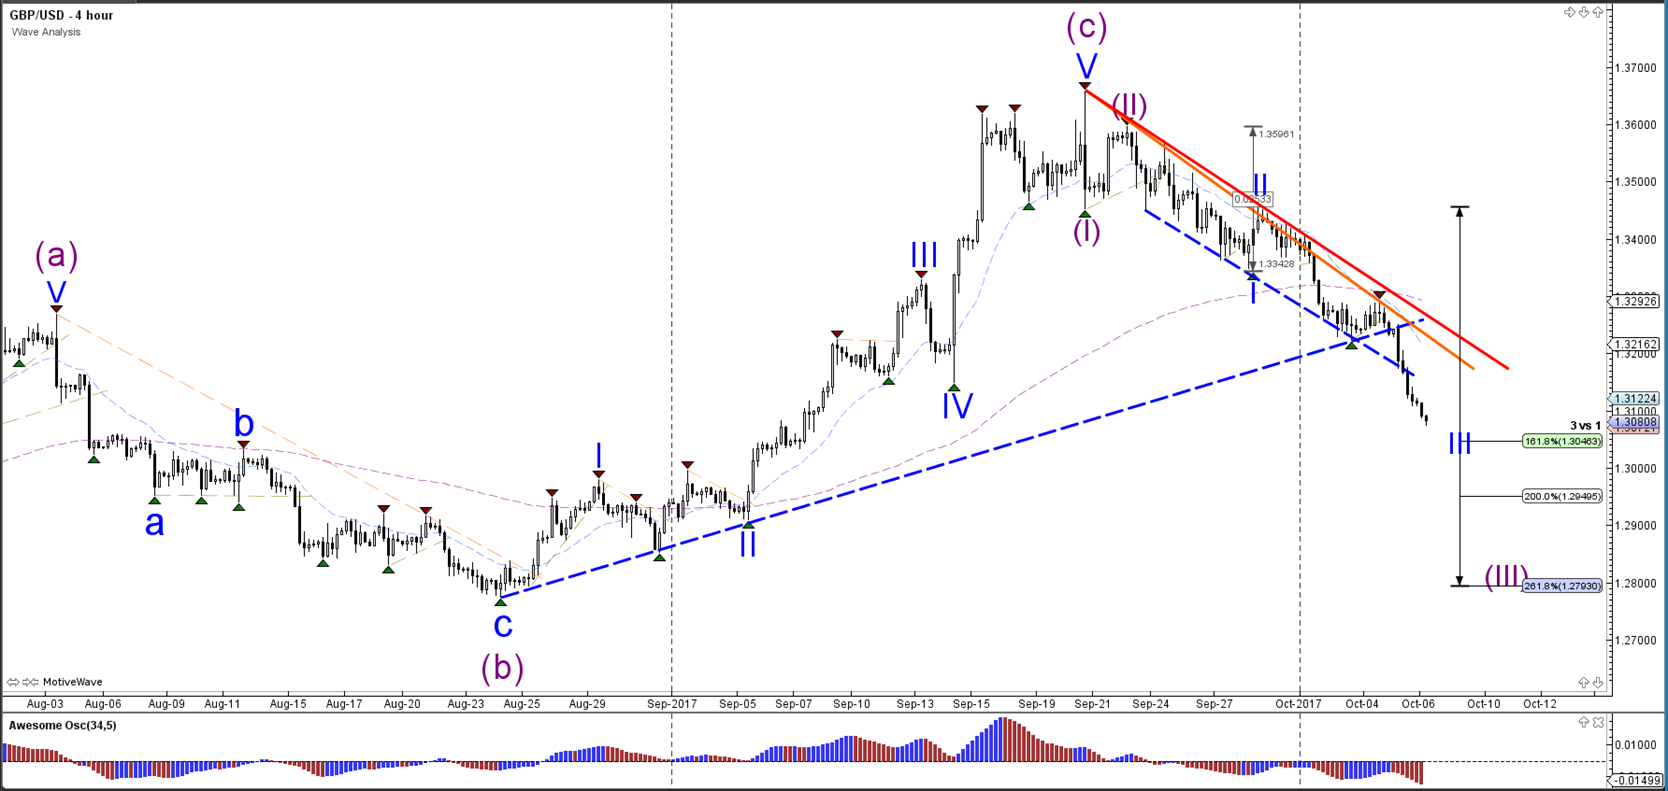
The GBP/USD has broken below the important long-term support trend line (dotted blue), the 1.3250 round level, and the potential 50% Fibonacci level of wave 4 mentioned yesterday. This bearish breakout invalidates the bullish wave structure and changes the structure to bearish with currently a wave 3 (blue).
1 hour
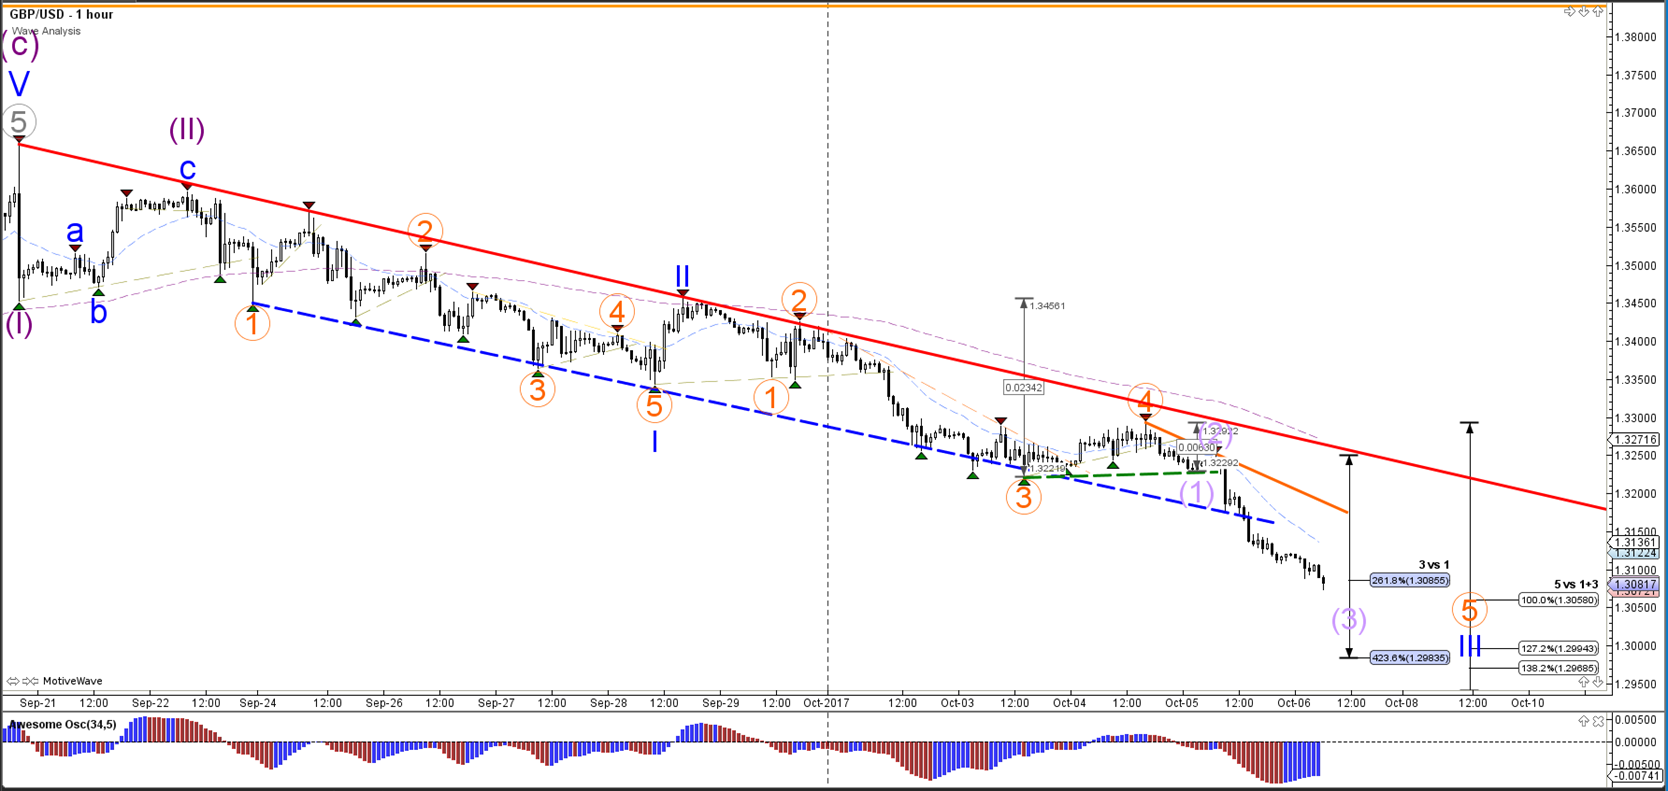
The GBP/USD break below the support trend lines (dotted lines) and is showing strong bearish momentum ever since the first breakout (dotted green).
EUR/USD
4 hour

The EUR/USD will most likely soon break below the support trend line (blue) due to the strong bearish momentum. A bearish breakout below it and the 23.6% Fibonacci level of wave 4 (blue) could see price fall towards the 38.2% Fibonacci level near 1.15.
1 hour
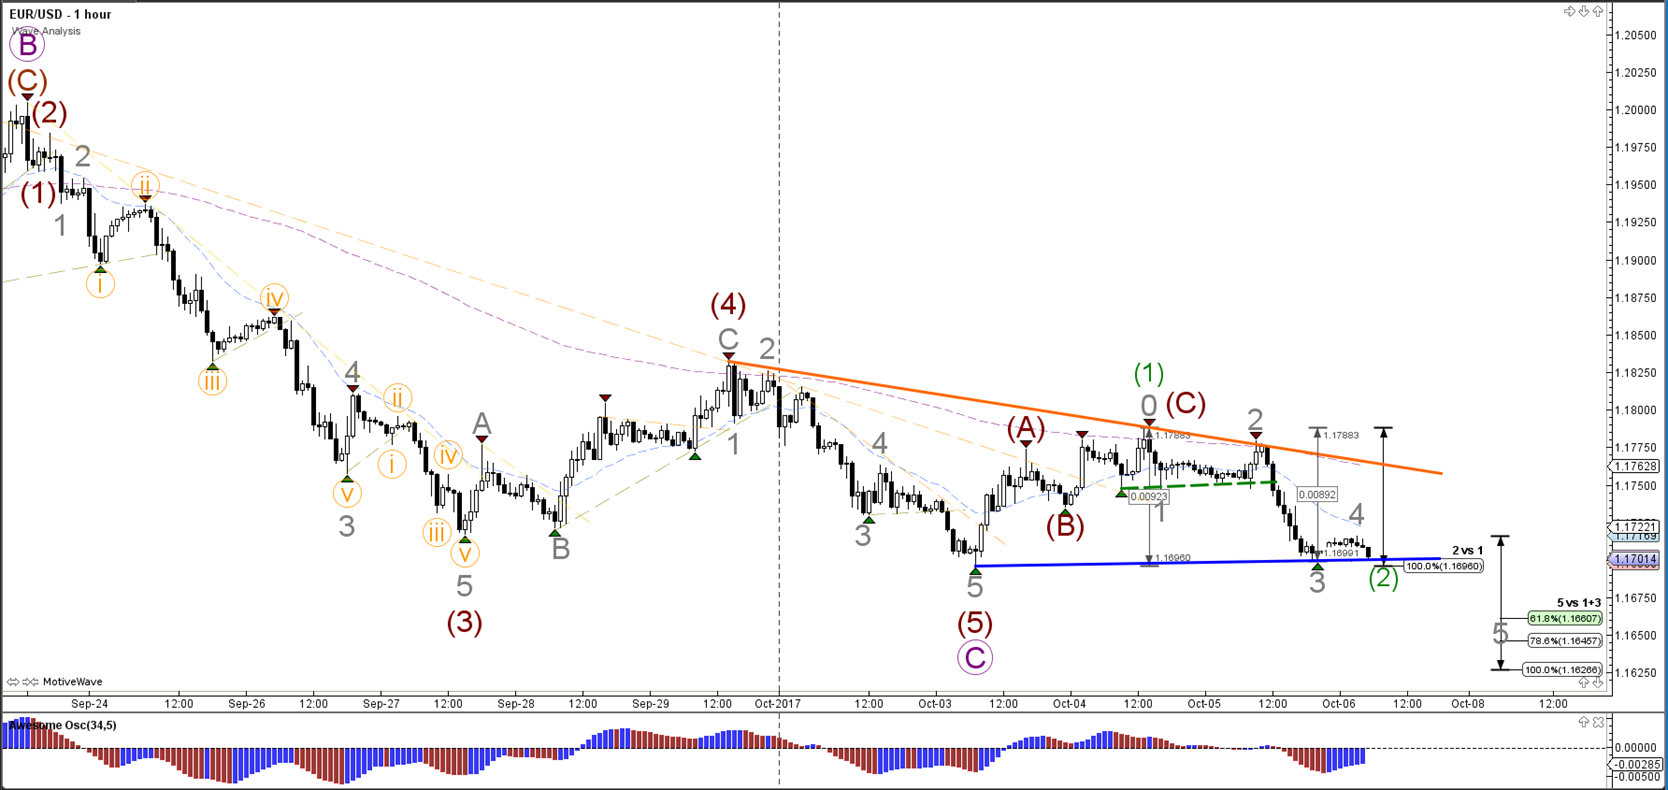
The EUR/USD will probably soon invalidate the bullish wave 1-2 (green), which also would mean that wave C (purple) has not yet been completed and is still open. A more likely wave scenario is indicating by the bearish 5 wave pattern (grey), which would be confirmed if price breaks below support.
USD/JPY
4 hour
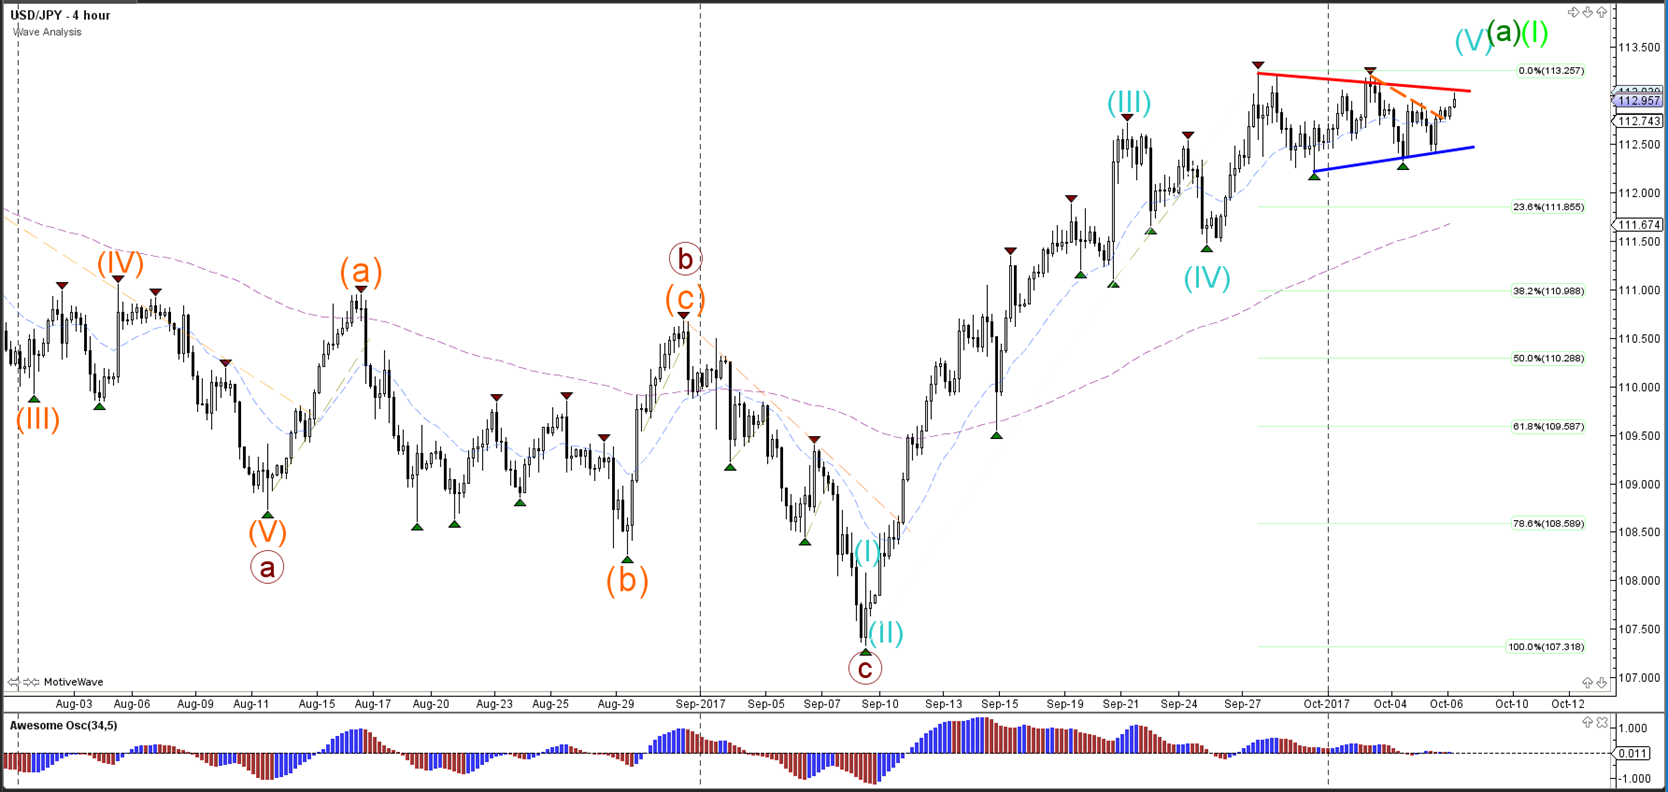
The USD/JPY is in a triangle pattern, which is indicated by the support (blue) and resistance (red) trend lines. The triangle pattern could indicate a pause with the uptrend and a bullish breakout above resistance (red) could take price up towards 114.50-115.
1 hour
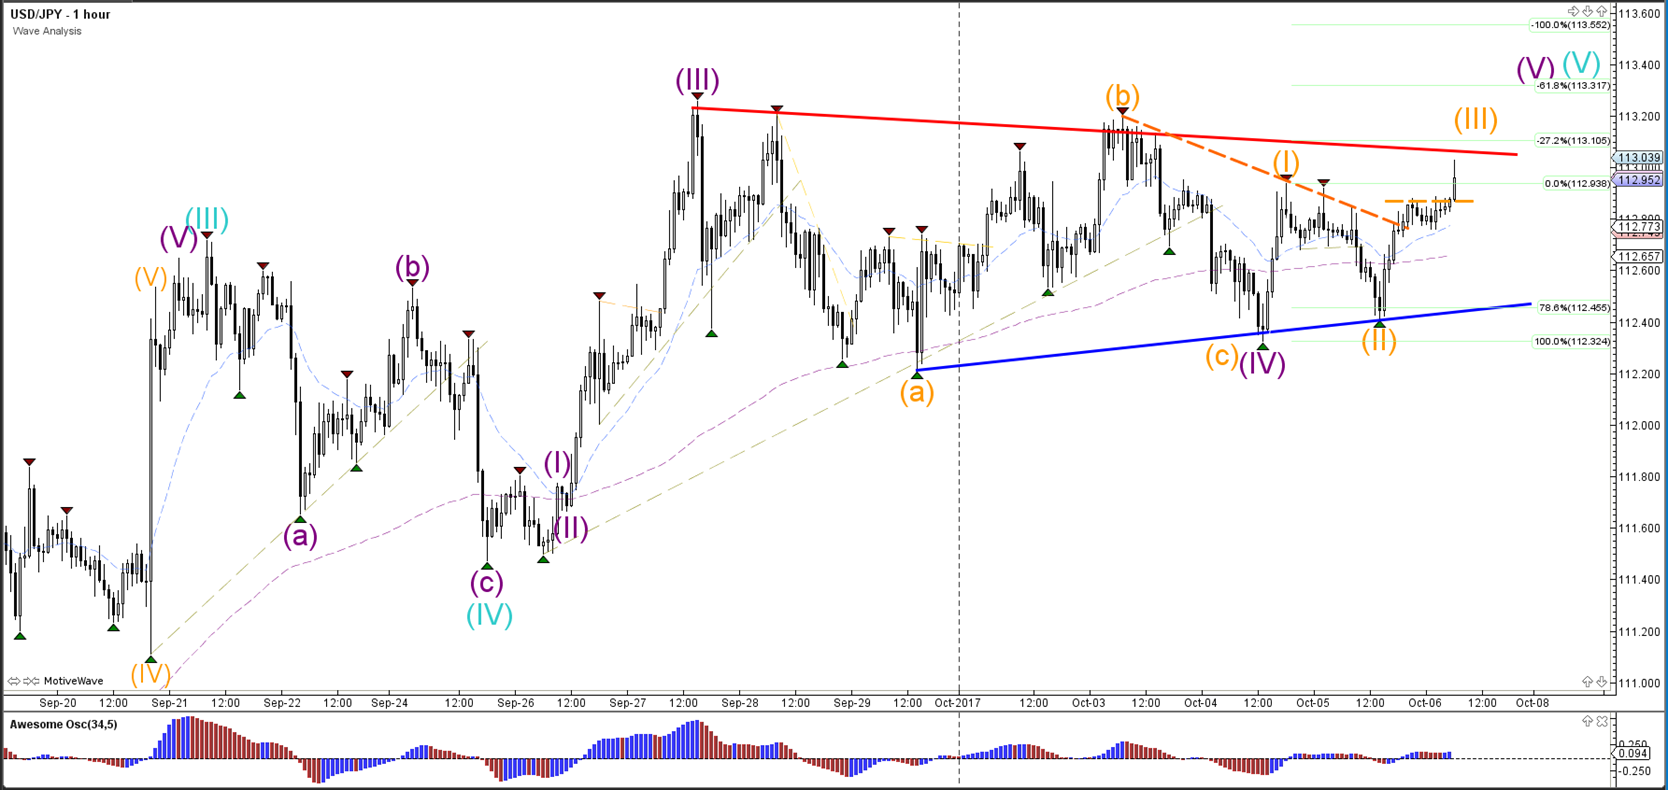
The USD/JPY broke above the resistance trend lines (dotted lines). The next bullish breakout could confirm a potential wave 3 (orange). In that case price has most likely expanded the wave 4 (purple) via a larger ABC (orange).


