EUR/USD
4 hour
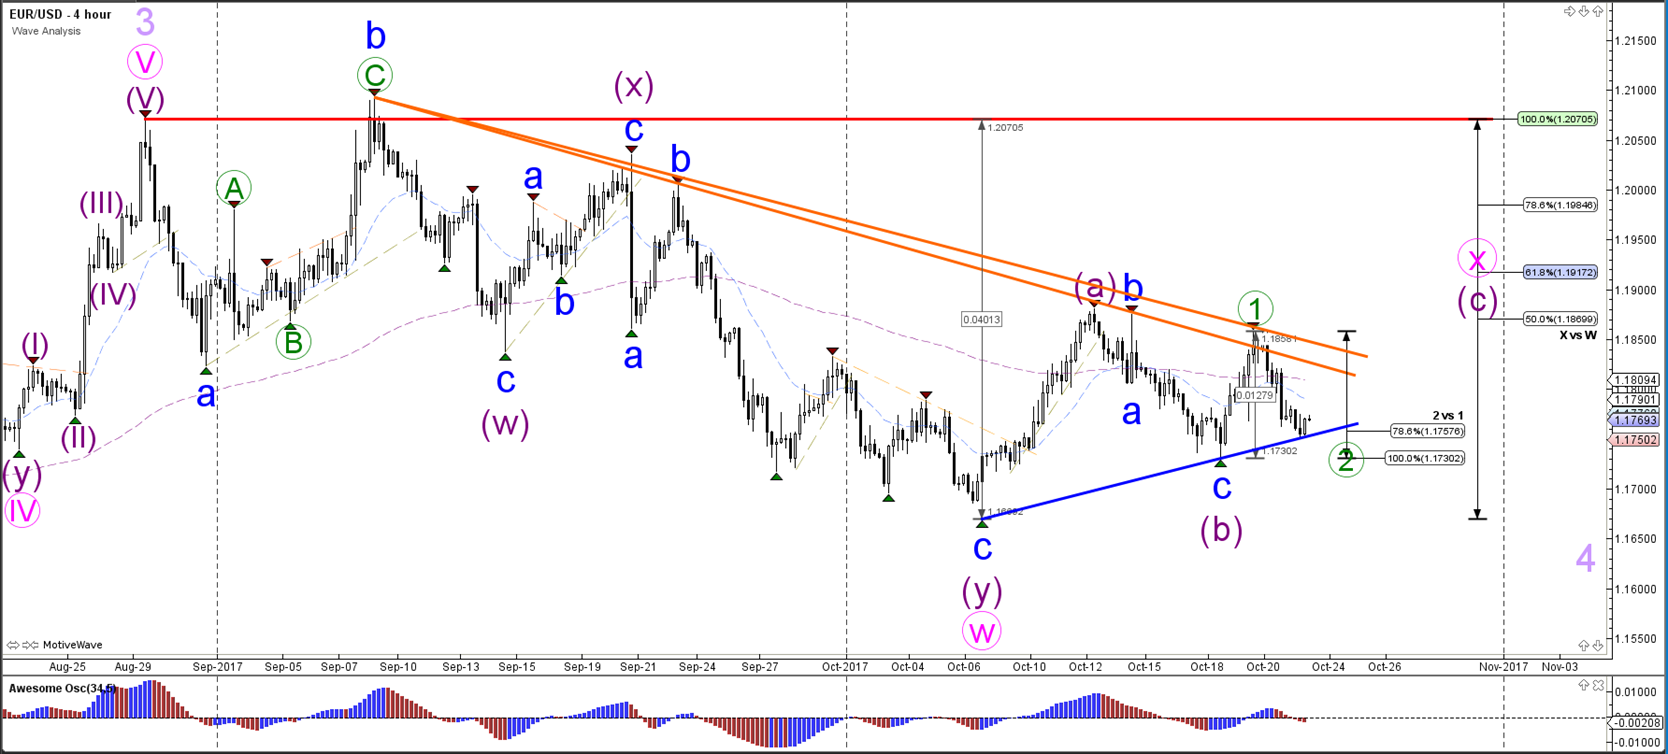
The EUR/USD bounced at the support trend line (blue) of the larger triangle chart pattern. A break above resistance would confirm a bullish breakout within wave C of wave X (pink). A break below the support trend line (blue) will probably indicate a larger correction within wave 4 (light purple).
1 hour
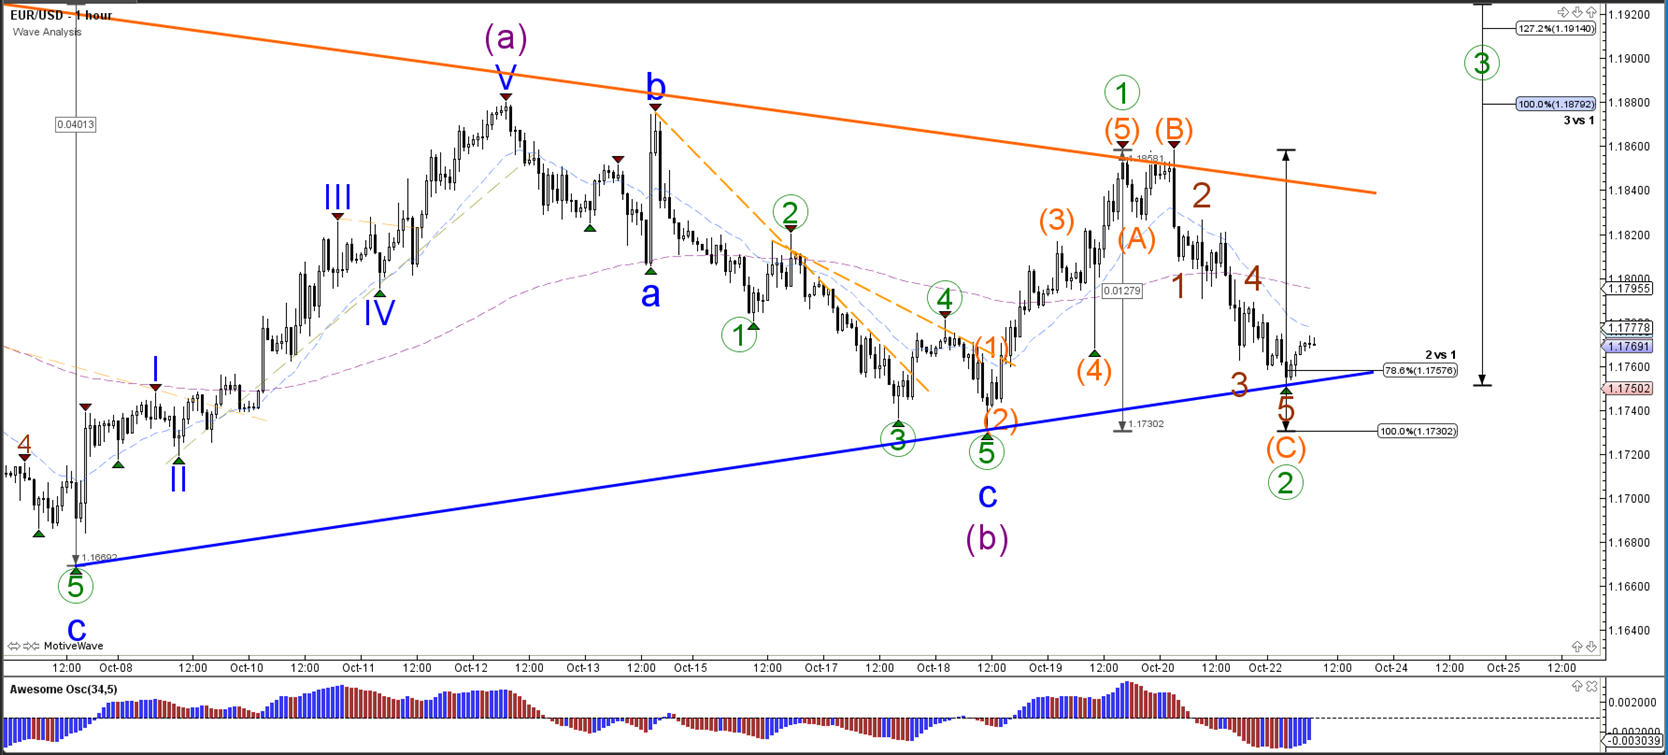
The EUR/USD could be building a wave 1-2 (green) if price stays above the 100% Fibonacci level of wave 2 vs 1.
GBP/USD
4 hour
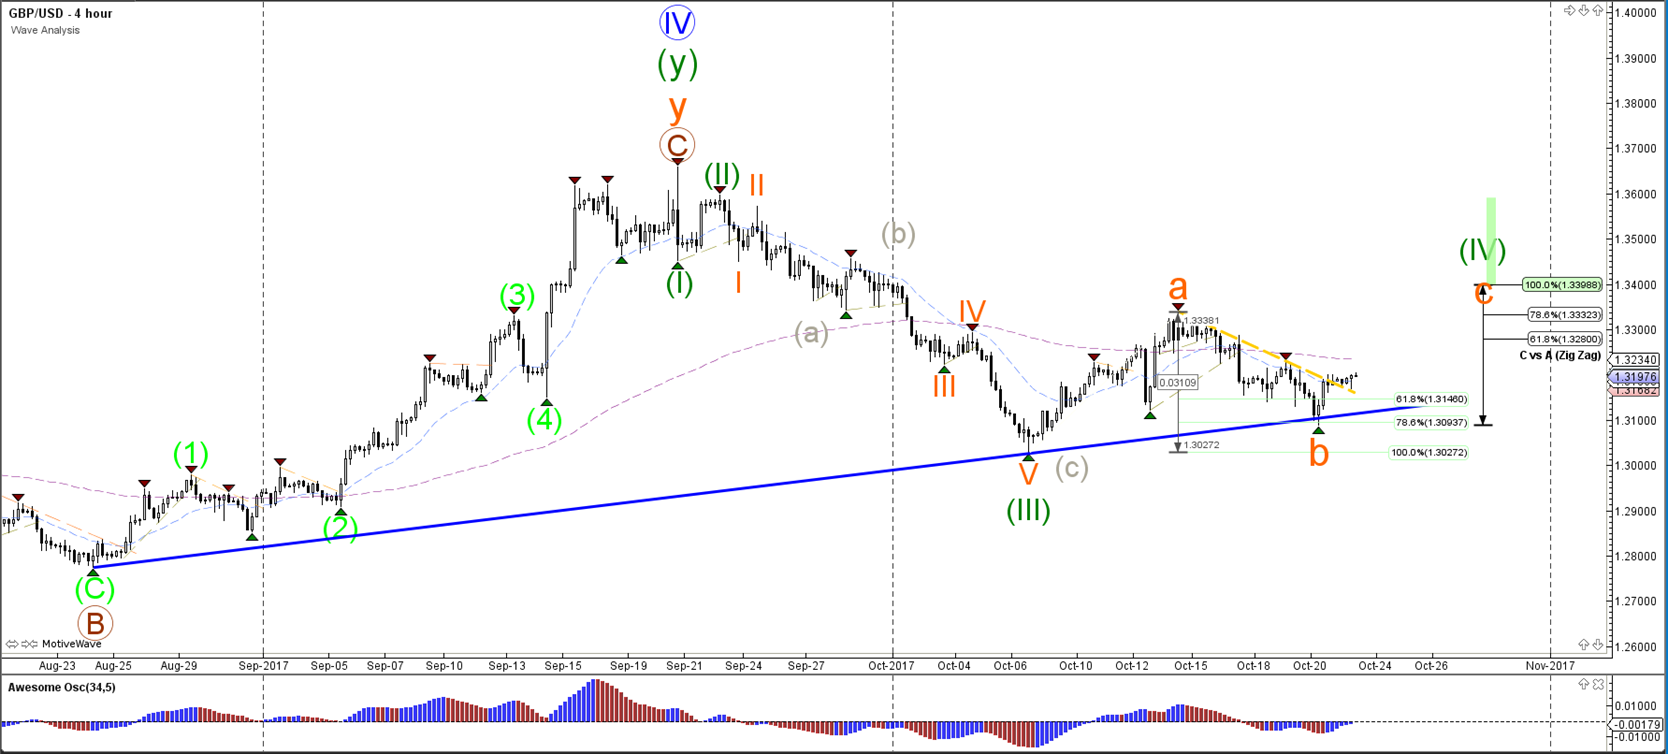
The GBP/USD has broken above the resistance trend line (dotted yellow) which could start a larger bullish movement within a potential wave C (orange).
1 hour
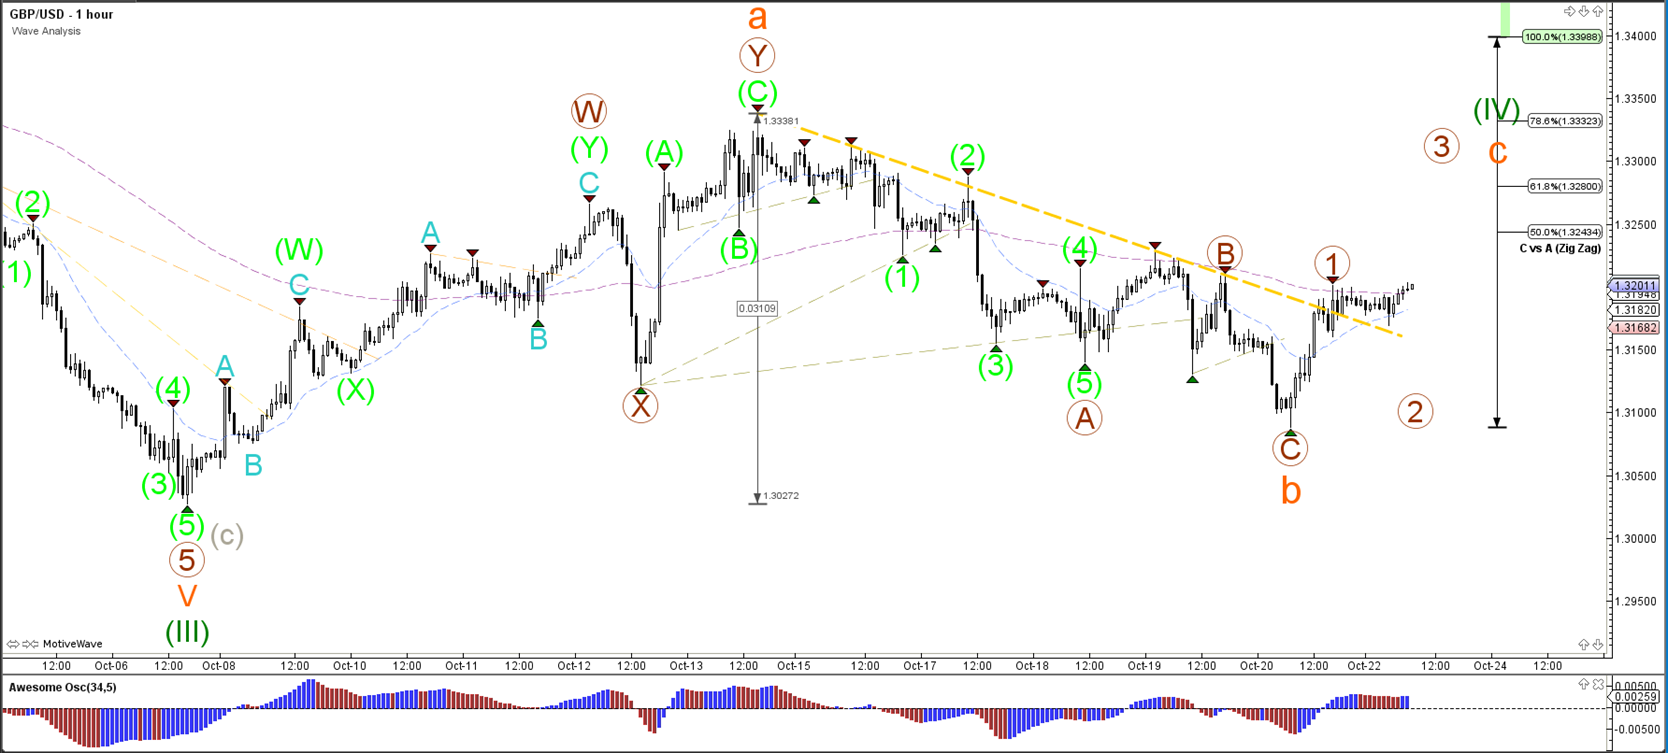
The GBP/USD bearish price action was corrective and choppy and resembles a wave B pattern.
USD/JPY
4 hour
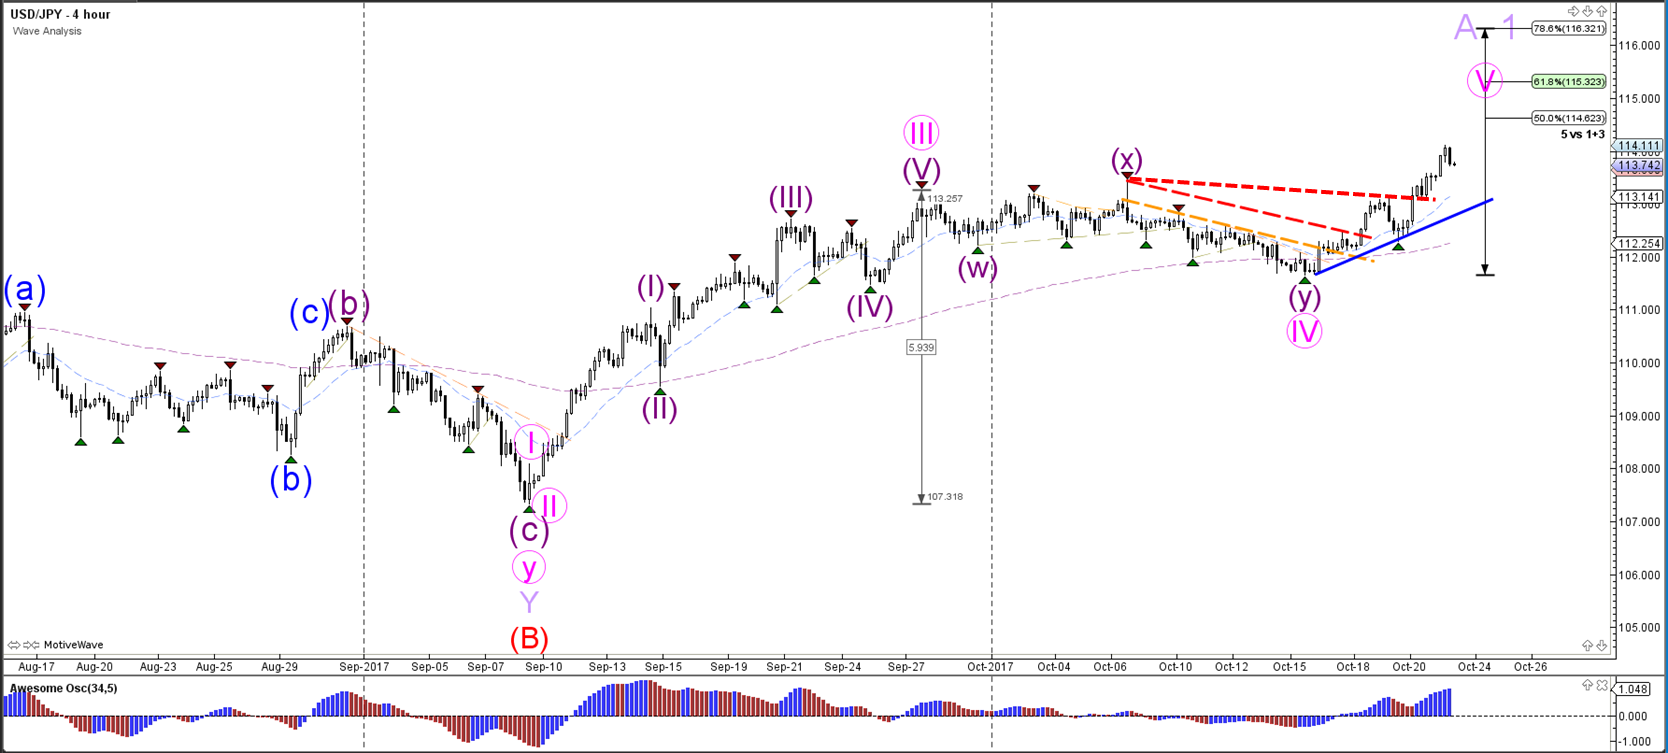
The USD/JPY broke again above a resistance trend line (dotted lines) and has changed the wave outlook to bullish as price moves towards the round 115 resistance level.
1 hour
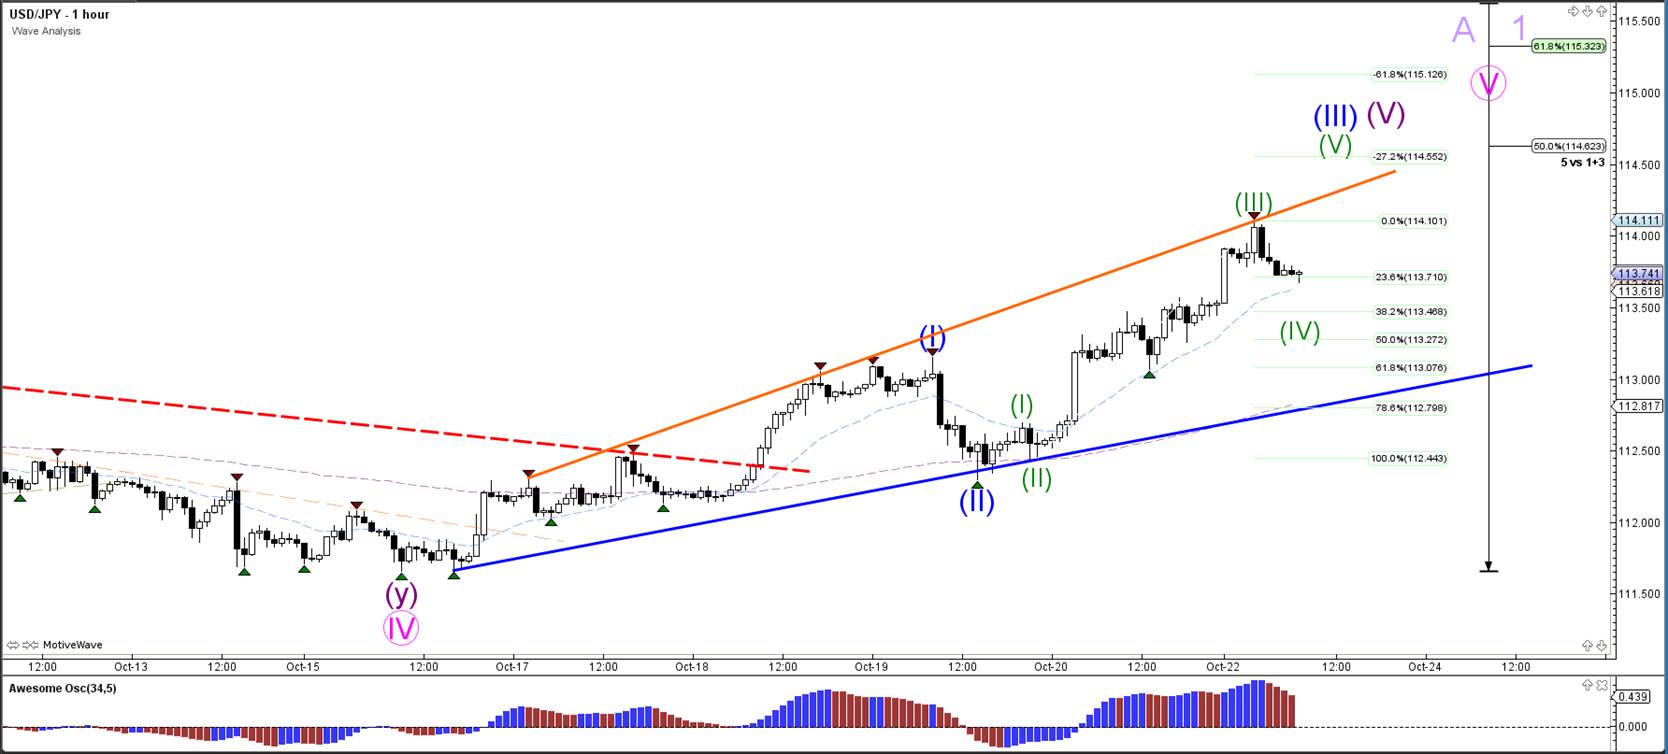
The USD/JPY is probably retracing within a wave 4 (green).


