ETH/USD Daily Chart
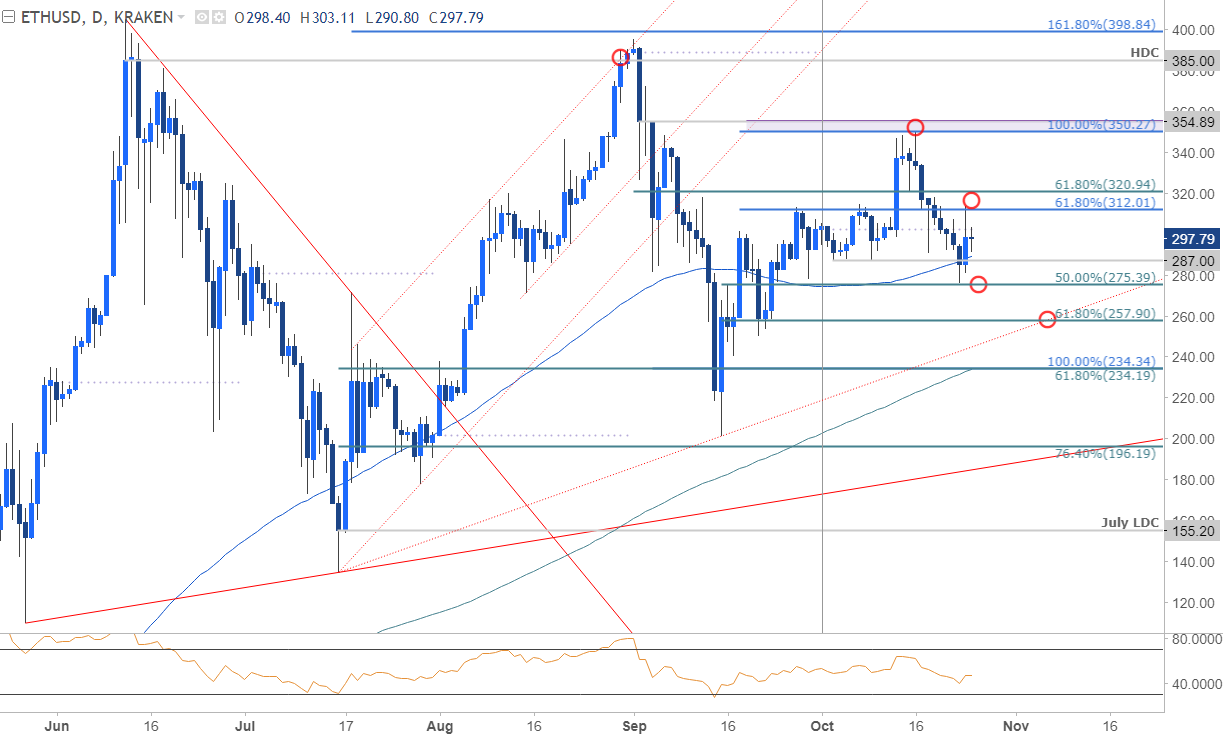
Technical Outlook: Earlier this month we noted that Ethereum prices had carved out an, “impressive monthly opening-rang just below key resistance at 312/21– a region defined by the 61.8% retracement of the September decline and the 61.8% ext of the advance off the subsequent lows.” A topside breach on October 13 saw prices rally into confluence resistance at 350/55 before reversing sharply lower. The decline failed to hold below the monthly opening-range lows with prices trading just below the monthly open.
The focus now falls on the 275-312/20 range- look for the break for guidance with broader bullish invalidation now set to confluence support at 257. A topside breach once again looks for a test of the 350/55resistance barrier where the 9/2 reversal-day close converges on the 100% ext.
ETH/USD 240min
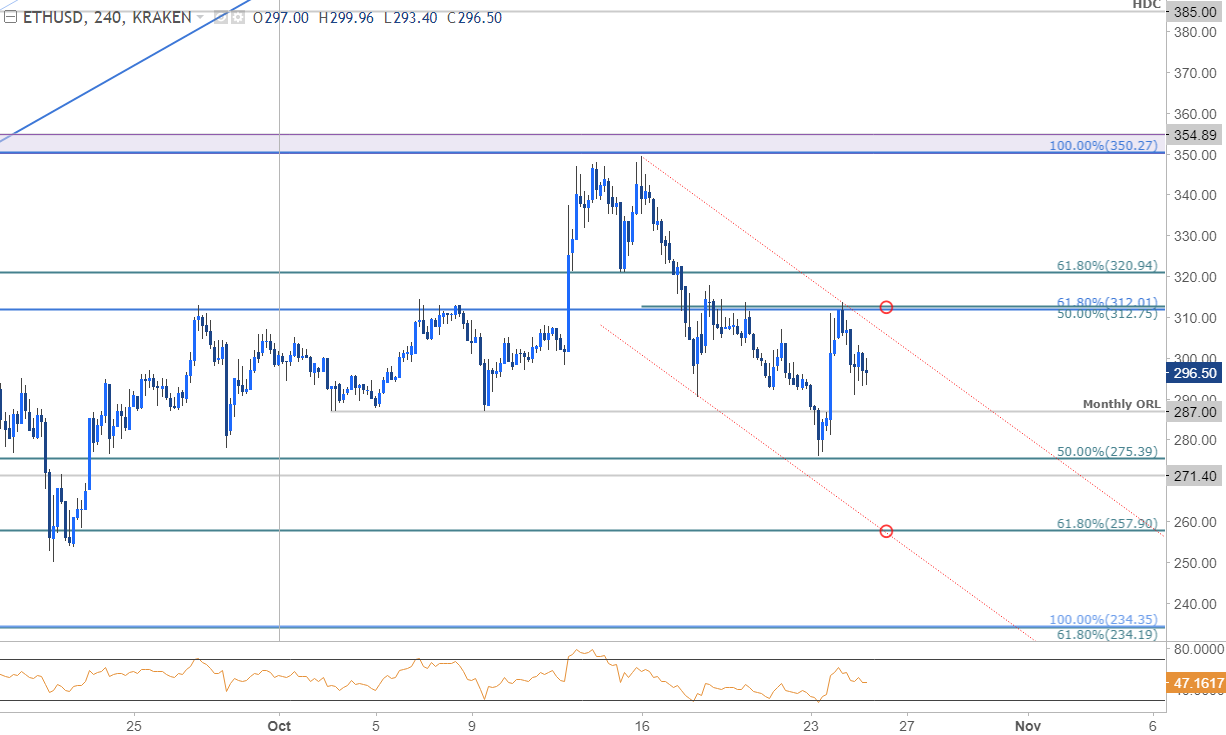
Notes: A closer look at price action further highlights the clear pivot back below the 312 inflection point. A near-term slope of the highs may be in play here and keeps the immediate focus lower while below this region. That said, a break lower would targets confluence support at the 61.8% retracement / lower parallel at 257– an area of interest for exhaustion / long-entries. Bottom line: the immediate risk is lower while with in this formation but ultimately, I want to be long on either a dip into key support OR a breach and retest of the 312 pivot zone.
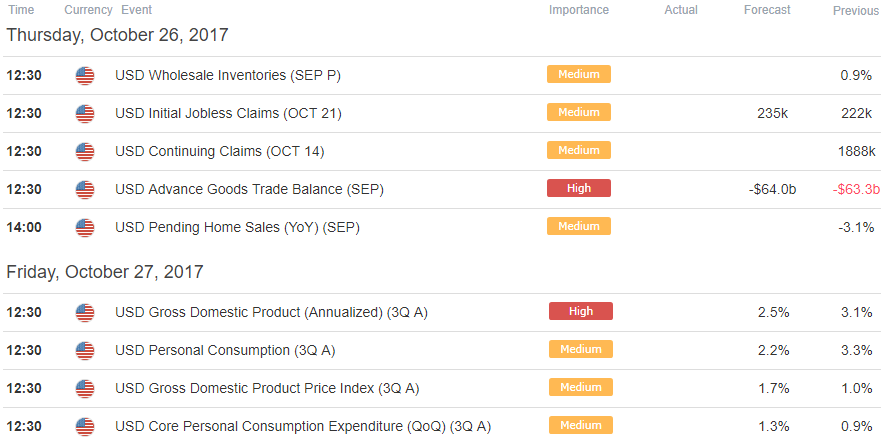
Relevant Data Releases