We are in the thick of the Q3 earnings season now, with more than 700 companies on deck to release results this week, including 180 S&P 500 members. With results from 87 S&P 500 members already out, as of Friday, October 20th, we will have crossed the halfway mark by the end of this week.
The results thus far provide a positive and reassuring view of corporate earnings, which will most likely get strengthened and reconfirmed through the remainder of this reporting cycle. Here are the three positives that we can glean either from the results that have come out already or can reasonably be expected to transpire in the coming days.
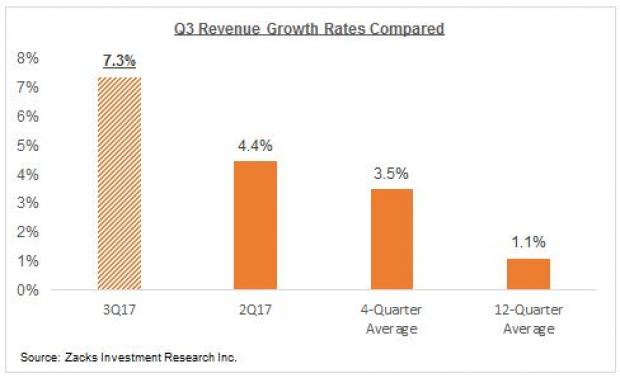
First, there is clear momentum on the revenue front, with growth notably accelerating from other recent periods. Total revenues for the 87 S&P 500 members that have reported results already are up +7.3% from the same period last year, which compares to +4.4% top-line growth for the same group of companies in the preceding quarter and still lower average growth rates in the prior periods, as the comparison chart below shows.
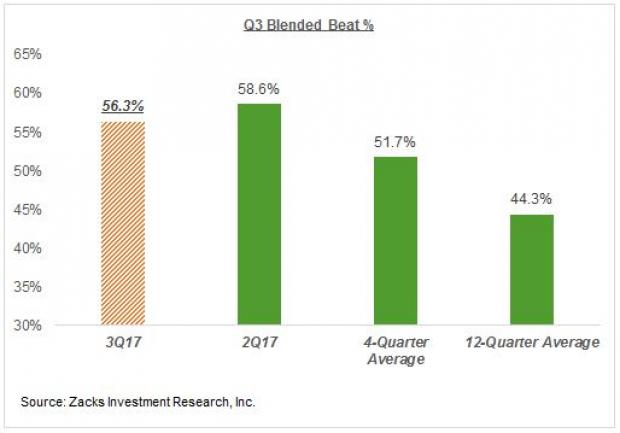
Second, the above-average proportion of positive surprises that we saw in the preceding period has continued this earnings season as well. We typically don’t give positive surprises a lot of weight in evaluating or assessing an earnings season since we all know that management teams are experts in managing expectations. Even then, the trend emerging in the Q3 earnings season is noteworthy for two reasons. First, estimates for the quarter had not fallen by as much as had historically been the case. Second, the proportion of positive revenue surprises, a much harder variable to manipulate relative to earnings, is only a shade below the preceding quarter’s record level.
The chart below shows the proportion of 87 S&P 500 members that have beaten both EPS and revenue estimates and how that compares to historical periods.
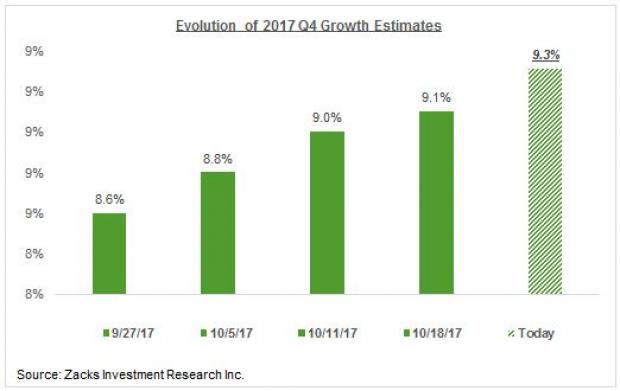
Third, the revisions trend for the December quarter is shaping up to be unusually favorable. The pattern over the last few years has been that as the quarterly earnings reporting season gets underway, estimates for the following quarter start coming down. Over the last few quarters, estimates would not fall by as much as was historically the case, but they were nevertheless coming down.
The unusual thing about the Q4 estimates is that they have actually gone up a bit over the last couple of weeks. This will most likely change as more companies report Q3 results and manage the market’s expectations for the December quarter, but it is nevertheless an unusually positive development.
The chart below shows the evolution of Q4 estimates since the quarter got underway.
Q3 Earnings Season Scorecard (as of Friday, October 20, 2017)
We now have Q3 results from 87 S&P 500 members that combined account for 24.7% of the index’s total market capitalization. Total earnings for these companies are up +9.4% from the same period last year on +7.3% higher revenues, with 71.3% beating EPS estimates and 70.1% beating revenue estimates.
The charts below compare the Q3 results thus far from the 87 index members with what we had seen from the same group of companies in other recent periods.
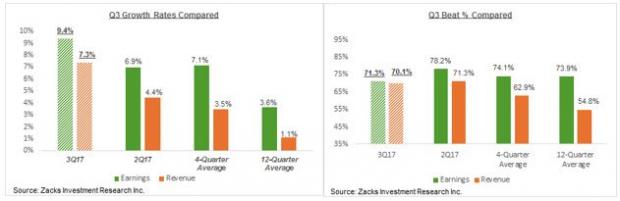
As you can see, the earnings and revenue growth pace is accelerating from what we had been seeing in the recent past, with the momentum on the revenue side particularly notable, as pointed out earlier.
This Week’s Key Earnings Releases
The chart below shows the weekly calendar of earnings releases for the entire Q3 earnings cycle. As you can see, the reporting cycle really starts ramping up this week, with 722 companies reporting results, including 180 S&P 500 members.

Monday (10/23): Halliburton (HAL – Free Report) is notable among the 10 S&P 500 members coming out with results on Monday, which will be interesting following Schlumberger’s (SLB – Free Report) comments about moderating North American oilfield activity levels. Halliburton’s very high level of North American exposure will make its take on the region’s outlook particularly important.
Tuesday (10/24): On a very busy reporting docket with 40 S&P 500 members reporting results (21 before the market’s open), the notable reports are from McDonald’s (MCD – Free Report) , Caterpillar (CAT), DuPont (DD), 3M (MMM – Free Report) and GM (GM – Free Report) .
Wednesday (10/25): We have 48 S&P 500 members reporting results today, of which 26 are coming out in the morning. Boeing (BA), Coke (KO – Free Report) and Visa (V – Free Report) are the notable reports today, all in the morning.
Thursday (10/26): This is the busiest day of the Q3 earnings season, with 68 index members reporting results (of which 41 are in the morning). Comcast (CMCSA),UPS (UPS – Free Report) and Ford (F – Free Report) are among the notable reports in the flood of earnings releases in the morning while Amazon (AMZN), Alphabet (GOOGL- Free Report) , Microsoft (MSFT – Free Report) and Intel (INTC – Free Report) are the notable reports after the market’s close.
Friday (10/27): Exxon (XOM) and Chevron (CVX) are the notable among the 14 index members reporting today, all in the morning.
The table below shows the summary picture for Q3, contrasted with what was actually achieved in Q2.
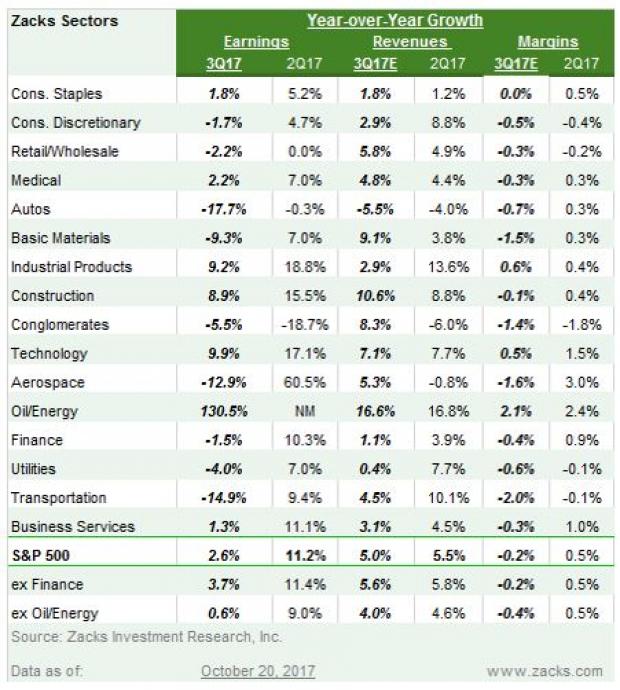
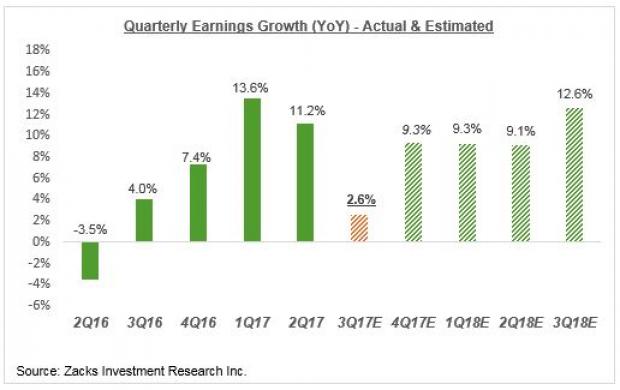
The chart below shows Q3 earnings growth expectations contrasted with what is expected in the following three quarters and actual results in the preceding 5 quarters. As you can see in the chart below, the growth pace has started decelerating from the double-digit level of the first two quarters of the year.
Finance Sector Scorecard
We have crossed the halfway mark, in terms of market cap, for the Finance sector, with results from 50.7% of the sector’s market cap in the S&P 500 index already out. Total earnings for these Finance sector companies that have reported are up +7.8% from the same period last year on +3.3% higher revenues, with 71.4% beating EPS estimates and 50% beating top-line estimates.
The chart below compares the growth pace (earnings and revenue) and proportion of positive surprises for these companies with what we saw from this same group of Finance sector companies in other recent periods.
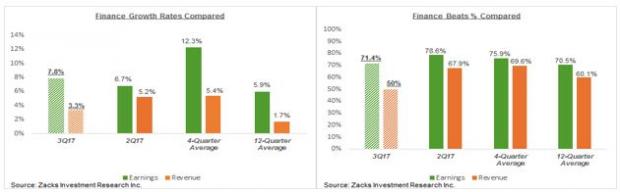
As you can see above, the aforementioned revenue momentum that we highlighted for this earnings season as a whole is not present in the Finance sector results.
Looking at Q3 earnings and revenue expectations for the sector as a whole, combining the reported actual results with the still-to-come estimates, Finance sector earnings are expected to be down -1.5% from the same period last year on +1.1% higher revenues. The chart below shows the sector’s Q3 earnings growth expectations contrasted with estimates for the following four quarters and actual results for the preceding two periods.
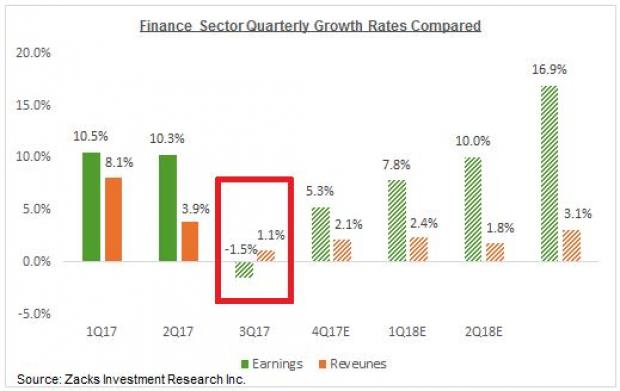
The sector’s earnings decline in Q3 will follow double-digit earnings growth in each of the two preceding quarters, as the chart above shows. Earnings growth is expected to be modestly positive for the banking industry, but the drag is coming from the insurance industry which has been hit hard by this recent run of damaging hurricanes.
The table below shows the sector’s Q3 earnings growth expectations at the medium-industry level contrasted with estimates for the following four quarters and actual results for the preceding three periods.
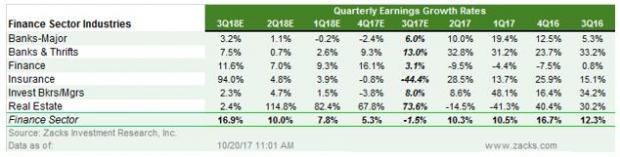
Please note that the Major Banks industry, of which JPMorgan, Wells Fargo and others are part, accounts for roughly 45% of the sector’s total earnings (insurance is the second biggest earnings contributor, accounting for about 25% of the total).
Here is a list of the 722 companies including 180 S&P 500 and reporting this week.


