Recently we have been pointing out how institutional investors have been quietly heading for the exit by selling stocks to cash in profits the past few weeks. The current Put/Call Ratio indicates investors are buying more put option contracts to hedge against lower near-term prices as they continue to dump stocks. Money managers continue to sit on more cash than they have in a very long time. As earnings season progresses investors are ‘selling the news’ at the current elevated prices and sitting on cash waiting to buy the next dip.
In the chart below the DOW Transportation index ($TRAN) is has diverged lower from the Dow Jones Industrial Average ($INDU). We look for DOW Transports and Industrials to move in synch for confirmation of the current trend. Technically, whenever these indexes pull away from each other, it is considered a weakening trend. You can see in the updated chart below how the transportation index has diverged lower away from the Dow Industrials. Last week we said “…Expect the Industrial index to retrench if the Transports don’t catch up soon. It is not always right and like everything else, it is subject to interpretation, but it does have a reasonably solid track record. Weakness in the Transports has occurred while the Dow Industrials continues to log multiple new highs…” The updated chart shows why this comparison is such a reliable indicator as the Dow Industrials are starting to retrench lower to follow the Dow Transports.
![]()
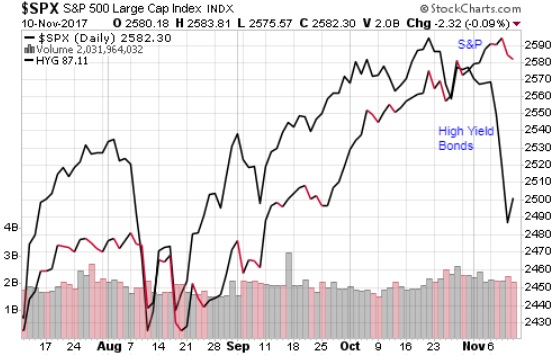
In the chart below the High Yield Corporate Bond Fund Index (HYG ) is has diverged lower from the S&P 500 Index ($SPX). High yield is a barometer of risk-taking. When high yield bonds start dropping, it might be yet another sign big money is moving away from risky assets.
A standard chart that we use to help confirm the overall market trend is the Momentum Factor ETF (MTUM) chart. Momentum Factor ETF is an investment that seeks to track the investment results of an index composed of U.S. large- and mid-capitalization stocks exhibiting relatively higher price momentum. This type of momentum fund is considered a reliable proxy for the overall stock market trend. We prefer to use the Heikin-Ashi format to display the Momentum Factor ETF. Heikin-Ashi candlestick charts are designed to filter out volatility in an effort to better capture the true trend. In the updated chart below our recent analysis is playing out as advertised where we said “…Retail investors are coming late to the party as professional money managers head for the exit. Expect prices to stall next week unless institutional investors return to the stock market…” The orange square in the updated chart below shows the upward price move stalling out to absorb the overbought condition. Also, the orange circle highlights momentum is trying to turn bearish.


