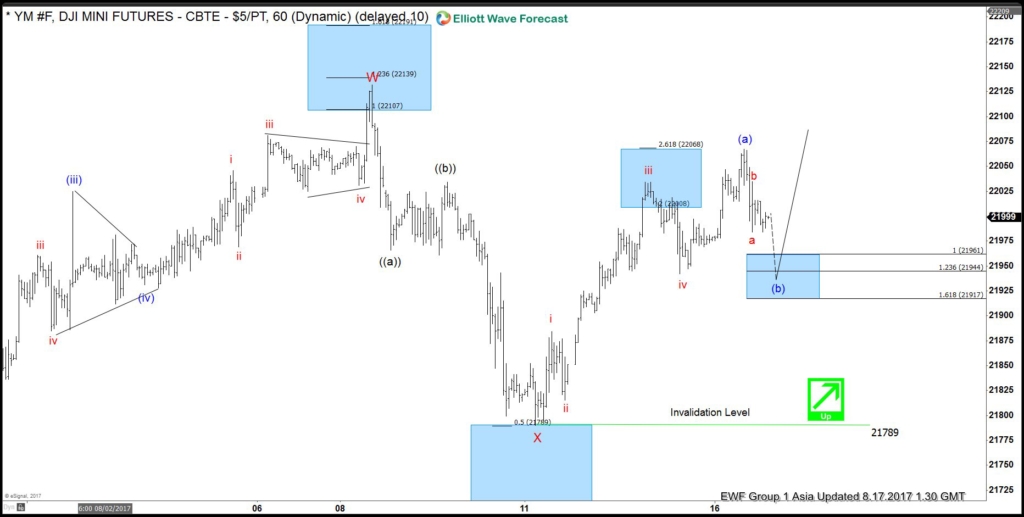
Short term Dow Futures (YM_F) Elliott Wave view suggests that rally from 6/29 low is unfolding as a a double three Elliott wave structure. Up from 6/29 low (21138), Minor wave W ended at 22132 and pullback to 21790 ended Minor wave X. Rally from there is unfolding as an impulse Elliott wave structure. Up from 21790, Subminutte wave i ended at 21884, Subminutte wave ii ended at 21815, Subminutte wave iii ended at 22034, Subminutte wave iv ended at 21942, and Subminutte wave v of (a) ended at 22067. Minutte wave (b) is in progress to correct cycle from 8/11 low in 3, 7, or 11 swing before the Index resumes the rally. We don’t like selling the proposed pullback and expect buyers to appear once Minutte wave (b) pullback is complete in 3, 7, or 11 swing provided pivot at 21787 low stays intact.
Dow Futures 1 Hour Elliott Wave Chart
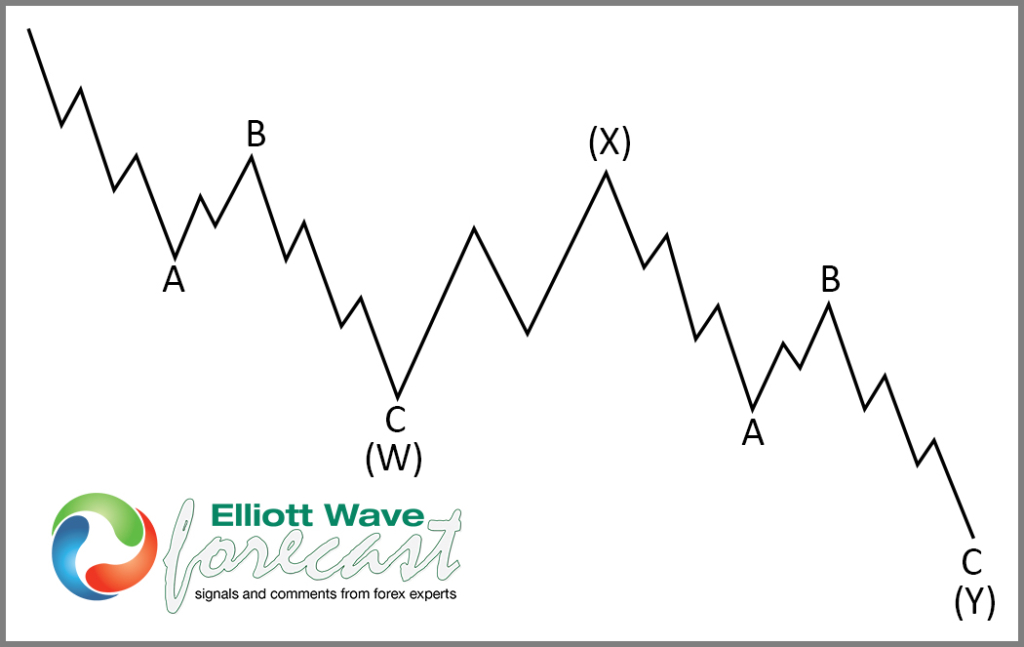
Double Three is the most important pattern in the new Elliott wave theory. It is also probably the most common pattern in the market these days. Double three is also known as a 7 swing structure. It is a very reliable pattern that gives traders good opportunity to trade with a well-defined invalidation level and target areas. The image below shows what Elliott Wave Double Three looks like. It has (W), (X), (Y) labels and an internal structure of 3-3-3, which means that all 3 legs have corrective sequences. Each (W) and (Y) is made of 3 waves oscillations & has a structure of A, B, C or another W, X, Y of a lesser extent.