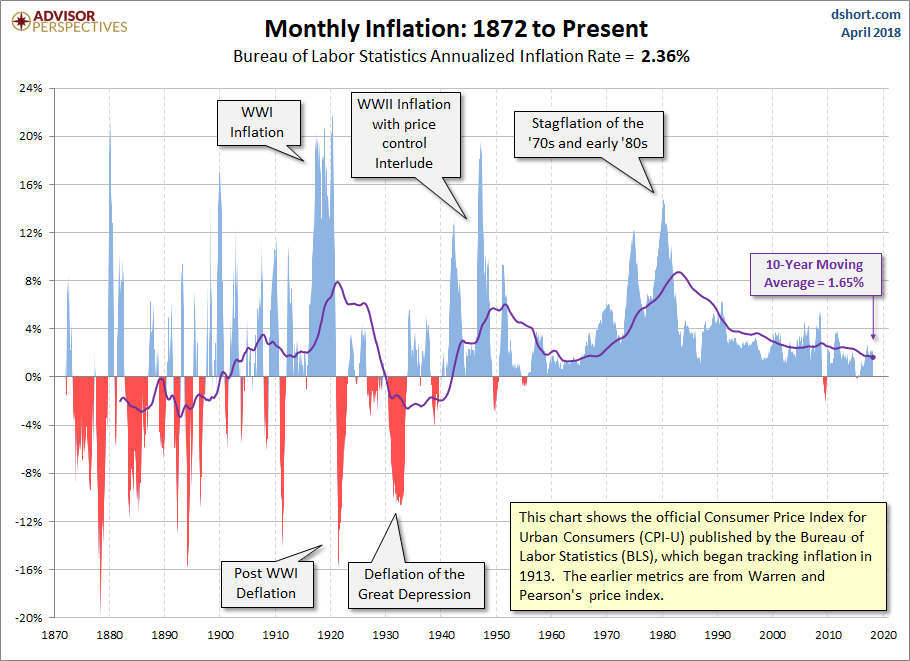
The Consumer Price Index for Urban Consumers (CPI-U) released yesterday puts the year-over-year inflation rate at 2.36%. It is substantially below the 3.76% average since the end of the Second World War and above its 10-year moving average, now at 1.65%.
- For a comparison of headline inflation with core inflation, which is based on the CPI excluding food and energy, see this monthly update.
- For a better understanding of how CPI is measured and how it impacts your household, see our Inside Look at CPI components.
- For an even closer look at how the components are behaving, see this X-Ray View of the data for the past six months.
The Bureau of Labor Statistics (BLS) has compiled CPI data since 1913, and numbers are conveniently available from the FRED repository (here). Our long-term inflation charts reach back to 1872 by adding Warren and Pearson’s price index for the earlier years. The spliced series is available at Yale Professor (and Nobel laureate) Robert Shiller’s website. This look further back into the past dramatically illustrates the extreme oscillation between inflation and deflation during the first 70 years of our timeline.
(Click on image to enlarge)
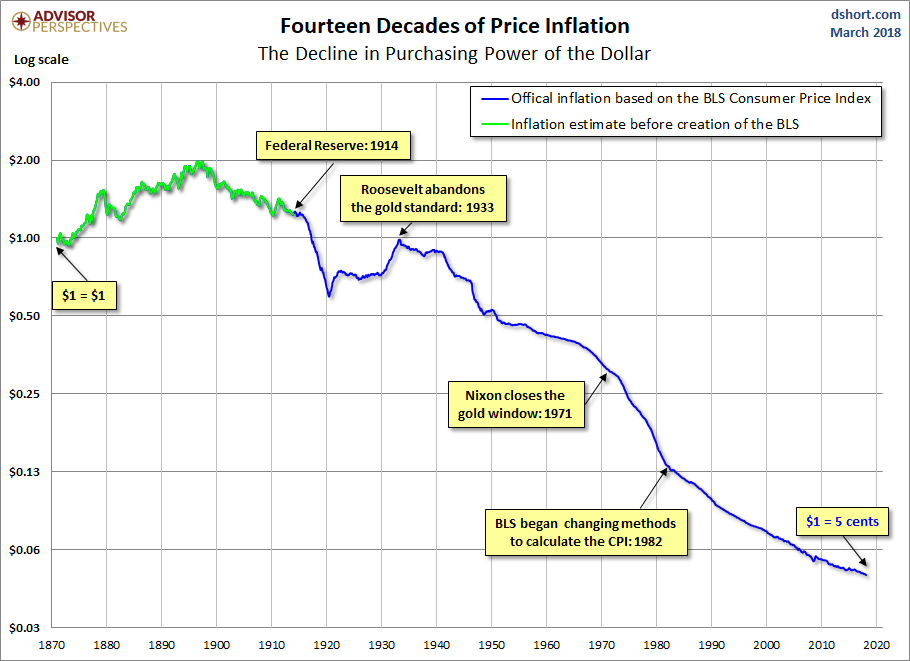
For a long-term look at the impact of inflation on the purchasing power of the dollar, check out this log-scale snapshot of fourteen-plus decades and how the value of the dollar has declined.
(Click on image to enlarge)